2011 Annual Report - USNH Financial Services - University System ...
2011 Annual Report - USNH Financial Services - University System ...
2011 Annual Report - USNH Financial Services - University System ...
You also want an ePaper? Increase the reach of your titles
YUMPU automatically turns print PDFs into web optimized ePapers that Google loves.
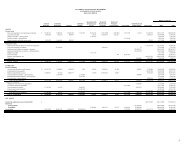
<strong>USNH</strong> <strong>2011</strong> ANNUAL REPORTA. RevenuesChart 1 shows revenue diversification in <strong>2011</strong>, and Chart 2 shows these samerevenues broken down by institution.<strong>USNH</strong> general appropriations for <strong>2011</strong> were 11% of total revenue. The 2012 stateoperating appropriation will decrease by $48.3 million so that state appropriationsare expected to be only 5.7% of total revenue in 2012 (see Chart 3).$450400350300250200150100500Chart 3: Twenty-Five Year Revenue Comparison(not including capital additions/deductions)($ in millions)19881989199019911992199319941995199619971998199920002001200220032004200520062007200820092010*BudgetedGrants and contracts, auxiliary enterprises, gifts, and other incomeTuition and fees (not netted for financial aid)State of NH general appropriations<strong>2011</strong>*2012Table 1: Full-Time Equivalent (FTE)Credit Enrollment in the Fall of Each Year2006 2007 2008 2009 2010UNH 13,741 13,856 13,925 14,250 14,211PSU 5,322 5,554 5,677 5,400 5,234KSC 4,550 4,815 4,979 5,084 5,096UNHM 848 861 840 889 913GSC 1,038 1,031 1,064 1,220 1,278Total <strong>USNH</strong> FTEs 25,499 26,117 26,485 26,843 26,732NH Resident 16,059 16,374 16,374 16,747 16,927Nonresident 9,440 9,743 10,111 10,096 9,805Total <strong>USNH</strong> FTEs 25,499 26,117 26,485 26,843 26,732Table 2: Freshman Applications, Acceptances and Enrollees atUNH at Durham in the Fall of Each Year2006 2007 2008 2009 2010Freshman applications received 13,991 15,122 16,246 16,132 16,545Freshman acceptances as % ofapplications (selectivity ratio) 67% 59% 65% 72% 73%Freshman enrolled as % ofacceptances (matriculation yield) 33% 30% 26% 26% 24%Student tuition and fees accounted for $390.9 million or 43%of <strong>USNH</strong> revenue in <strong>2011</strong> as enrollments at <strong>USNH</strong> institutionscontinued to grow. In the past four years, credit enrollmentsat <strong>USNH</strong> have increased 4.8%, or 1,233 FTE students, includingincreases of 868 resident students and 365 nonresident students(see Table 1).As seen in Table 2, there has been an 18% growth in annualapplications to the flagship campus, UNH at Durham, over thepast four years. During this period of growth <strong>USNH</strong> institutionshave maintained or improved the quality of their incomingstudents. Approximately 47% of new UNH students in the fallof 2010 ranked in the top 20% of their high school class. Thisis equal to the percentage in 2006. The combined SAT scoresfor new UNH students averaged 1105 in the fall of 2010, nearlyidentical to the 1104 average in the fall of 2006.The growth in enrollments combined with the economicdownturn has resulted in significant increases in need-basedstudent financial aid, particularly in 2010 and <strong>2011</strong>. Need-basedawards were up $10.1 million (14.8%) from 2010 to <strong>2011</strong> whileother types of aid remained fairly constant. This compares toan increase of $19.0 million (38.5%) from 2009 to 2010, and anincrease of $38.0 million or 94.2% over the 2007 level.All campuses are working to generate revenues from facilitiesusage over the full year rather than just during the traditionalsemesters. In 2010 UNH added a highly successful shortsemester during the winter break. In addition, each campus isexpanding online as well as summer session courses to increasecapacity for additional enrollments without adding significantcosts. Summer housing opportunities are also being added tocomplement these programs.Auxiliary revenues grew $4.2 million and $11.1 million in<strong>2011</strong> and 2010, respectively. The primary components ofthis revenue stream are enrollment-driven including studenthousing, dining, health, recreation and transportation fees. In<strong>2011</strong> and 2010 auxiliary revenue also included $1.6 million and$0.9 million, respectively, from renewable energy credit andelectricity sales generated by UNH’s recently completed ECOLinerenewable methane gas pipeline (see the Capital and DebtActivities section for more information on energy infrastructureinitiatives).Grant revenues in <strong>2011</strong> are up $28.3 million or 19.9% over 2010.This compares to an increase of $7.9 million or 5.9% from 2009to 2010. Sponsors of UNH awards include the US government,the state, foundations, non-profits and the commercial sector.The ten-year record of UNH competitively-won awards forresearch and other sponsored programs is shown in Chart4. The large increase in <strong>2011</strong> is due to a single $44.5 million,three-year American Recovery and Reinvestment Acts (ARRA)award to UNH for the Network New Hampshire Now projectto implement high-speed broadband “dark fiber” to all tencounties of the state. Including cost sharing commitments frompublic and private partner organizations, this complex projectis expected to cost $65.9 million and includes 450 miles of fiber.Upon completion in 2013, the benefits will include high-speedinternet access for nearly all major institutions and businesses inNew Hampshire.Facilities and administrative cost recoveries on grants andcontracts totaled approximately $20.6 million in <strong>2011</strong> and $18.4million and $18.5 million in each of 2010 and 2009, respectively.This important unrestricted revenue stream is used to support16


