2011 Annual Report - USNH Financial Services - University System ...
2011 Annual Report - USNH Financial Services - University System ...
2011 Annual Report - USNH Financial Services - University System ...

You also want an ePaper? Increase the reach of your titles
YUMPU automatically turns print PDFs into web optimized ePapers that Google loves.
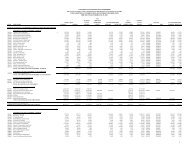
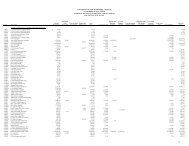
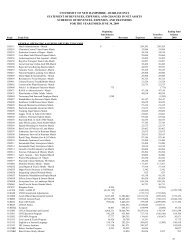
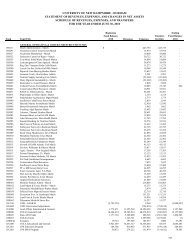
<strong>USNH</strong> <strong>2011</strong> ANNUAL REPORT11. Net AssetsThe table below details <strong>USNH</strong> net assets as of June 30, <strong>2011</strong> and 2010 ($ in thousands):<strong>2011</strong> 2010Invested in capital assets, net of related debt $ 492,675) $487,512)RestrictedNonexpendableHistoric gift value of endowment-campuses 85,626) 80,653)Historic gift value of endowment-affiliated entities 110,745) 106,406)Total restricted nonexpendable net assetsExpendable196,371) 187,059)Held by campuses:Accumulated net gains (losses) on endowment 34,791) 19,936)Fair value of funds functioning as endowment 12,208) 10,752)Gifts, grants and contracts 24,511) 21,100)Life income and annuity funds 101) 73)Loan funds 6,451) 6,452)Held by affiliated entities:Accumulated net gains (losses) on endowment 21,039) 3,942)Other 13,244) 10,934)UnrestrictedTotal restricted expendable net assets 112,345) 73,189)Held by campuses:Educational and general reserves 23,164) 32,365)Auxiliary enterprises 28,878) 27,552)Internally designated 31,186) 50,323)Unrestricted loan funds 1,305) 1,327)Unexpended plant funds 46,497) 44,400)Fair value of unrestricted funds functioning as endowment 39,920) 25,879)Subtotal 170,950) 181,846)Unrestricted balances approved for spending infollowing fiscal year 85,259) 10,315)Unfunded postretirement medical liability (52,083) (46,758)Total unrestricted net assets held by campuses 204,126) 145,403)Held by affiliated entities:Fair value of unrestricted funds functioning as endowment 1,121) 928)Other 3,449) 2,835)Total unrestricted net assets 208,696 149,166)Total net assets $1,010,087) $896,926)Unrestricted balances approved for spending in the following fiscal year include unspentproceeds from internal borrowings, unrestricted quasi-endowment funds created to supportdebt service requirements of the Series 2007 and Series 2009A Bonds, campus balancesapproved for support of major construction projects, and amounts approved to supportseparation incentive offerings and other strategic initiatives.)12. Endowment return used for operationsThe majority of endowment funds are invested in one of two investment pools using the unitshare method. The <strong>2011</strong> endowment distribution rate per unit as a percentage of the average13. Operating expenses by functionmarket value per unit for the twelve quarters from which it was derived was 4.2% for the <strong>USNH</strong>endowment pool and 5.2% for the UNHF endowment pool. This compares to 3.8% for the<strong>USNH</strong> endowment pool and 4.8% for the UNHF endowment pool in 2010.The annual spending formula for endowment return used for operations is designed toprovide sustainable continued future support for ongoing programs at current levels assumingmoderate inflation. To the extent that endowment yield is insufficient in any one year to meetthe required spending distribution, accumulated net gains are utilized to fund the distribution.The components of endowment return used for operations for <strong>2011</strong> and 2010 are summarizedbelow ($ in thousands):<strong>2011</strong> 2010Pooled endowment yield - campuses $ 2,014 $ 1,252Pooled endowment yield - affiliates 2,558 1,902Trusts, life income and annuities yield 300 288Gains utilized to fund distribution 7,813 8,369Endowment return used for operations $12,685 $11,81114. Pass-through grants<strong>USNH</strong> began participating in the U.S. Department of Education Federal Direct Lending programduring fiscal year 2010. <strong>USNH</strong> distributed $185,733,000 and $39,691,000 of student loansthrough this program during <strong>2011</strong> and 2010, respectively. These distributions and relatedfunding sources are not included as expenses and revenues, or as cash disbursements andcash receipts, in the accompanying financial statements. The statement of net assets includesreceivables of $369,000 and $373,000 as of June 30, <strong>2011</strong> and 2010, respectively, for directloans disbursed in excess of U.S. Department of Education receipts.15. Other nonoperating revenue (expense)On June 24, 2010 the <strong>USNH</strong> Board of Trustees approved a $25,000,000 voluntary contributionto the State of New Hampshire. This payment was made on June 28, 2010 to help mitigatefiscal difficulties at the state level. This is a one-time payment to the state and is not a reductionof general appropriation funds received. No contributions to the State were made in <strong>2011</strong>.16. Related Party – UNH School of LawOn August 31, 2010 UNH and Franklin Pierce Law Center Corporation (FPLC) officially affiliatedand the FPLC became known as the UNH School of Law. The affiliation is expected to enhancethe academic diversity and missions of the respective institutions. UNH is now the sole memberof the UNH School of Law and holds limited reserved powers as the primary institution.However, the majority of the financial burden and administrative control resides with the UNHSchool of Law Board of Trustees and will remain there until that Board votes to approve a merger,change the terms of the affiliation, or dissolve the affiliation. The UNH School of Law maintainsits financial records in accordance with generally accepted accounting principles prescribed bythe <strong>Financial</strong> Accounting Standards Board rather than GASB. No balances of the UNH Schoolof Law are included in these financial statements. A copy of the complete annual report for theUNH School of Law can be obtained by contacting the Business Office at (603) 513-5121.17. Subsequent eventThe State of New Hampshire budget as enacted in July <strong>2011</strong> reduces general appropriationfunding for <strong>USNH</strong> to $51,650,000 and $54,650,000 for fiscal years 2012 and 2013, respectively.This compares to $100,000,000 of funding received in <strong>2011</strong>. To offset this significant decreasein revenue, <strong>USNH</strong> intends to limit expenses, increase tuition rates, and utilize a modest amountof unrestricted net assets.The following table details <strong>USNH</strong> operating expenses by functional classification ($ in thousands):Supplies Internal <strong>2011</strong> 2010Compensation and services Utilities allocations Depreciation Total TotalCampuses – current fundsInstruction $199,503) $ 23,255 $ 74 $ 1,242) $ -) 99$224,074 $206,264Research & sponsored programs 72,645) 52,800 88 -) -) 125,533 103,159Public service 7,516) 1,298 6 1,627) -) 10,447 9,601Academic support 42,096) 15,627 12 314) -) 58,049 55,408Student services 22,839) 10,916 11 5,225) -) 38,991 38,653Fundraising 6,750) 1,773 - (3,115) -) 5,408 3,726Other Institutional support 35,964) 11,882 27 (14,998) -) 32,875 31,361Operations & maintenance 26,449) 8,122 15,223 (23,767) -) 26,027 23,263Auxiliary student services 49,895) 57,740 2,146 33,449) -) 143,230 141,083Subtotal-current funds 463,657) 183,413 17,587 (23) - 664,634 612,518Campuses – other funds 186) 13,851 29 -) 49,847 63,913 57,783Affiliated entities 7,414) 5,287 230 23) 883 13,837 14,415Total $471,257) $202,551 $17,846 $ -) $50,730 $742,384 $684,71632