2011 Annual Report - USNH Financial Services - University System ...
2011 Annual Report - USNH Financial Services - University System ...
2011 Annual Report - USNH Financial Services - University System ...

You also want an ePaper? Increase the reach of your titles
YUMPU automatically turns print PDFs into web optimized ePapers that Google loves.
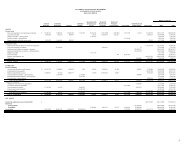
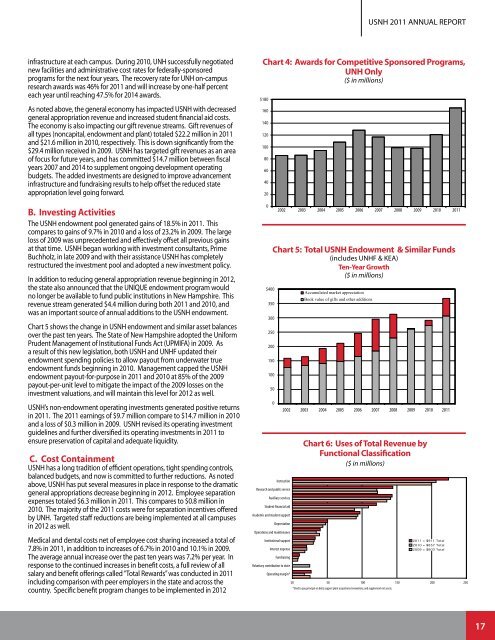
<strong>USNH</strong> <strong>2011</strong> ANNUAL REPORTinfrastructure at each campus. During 2010, UNH successfully negotiatednew facilities and administrative cost rates for federally-sponsoredprograms for the next four years. The recovery rate for UNH on-campusresearch awards was 46% for <strong>2011</strong> and will increase by one-half percenteach year until reaching 47.5% for 2014 awards.As noted above, the general economy has impacted <strong>USNH</strong> with decreasedgeneral appropriation revenue and increased student financial aid costs.The economy is also impacting our gift revenue streams. Gift revenues ofall types (noncapital, endowment and plant) totaled $22.2 million in <strong>2011</strong>and $21.6 million in 2010, respectively. This is down significantly from the$29.4 million received in 2009. <strong>USNH</strong> has targeted gift revenues as an areaof focus for future years, and has committed $14.7 million between fiscalyears 2007 and 2014 to supplement ongoing development operatingbudgets. The added investments are designed to improve advancementinfrastructure and fundraising results to help offset the reduced stateappropriation level going forward.B. Investing ActivitiesThe <strong>USNH</strong> endowment pool generated gains of 18.5% in <strong>2011</strong>. Thiscompares to gains of 9.7% in 2010 and a loss of 23.2% in 2009. The largeloss of 2009 was unprecedented and effectively offset all previous gainsat that time. <strong>USNH</strong> began working with investment consultants, PrimeBuchholz, in late 2009 and with their assistance <strong>USNH</strong> has completelyrestructured the investment pool and adopted a new investment policy.In addition to reducing general appropriation revenue beginning in 2012,the state also announced that the UNIQUE endowment program wouldno longer be available to fund public institutions in New Hampshire. Thisrevenue stream generated $4.4 million during both <strong>2011</strong> and 2010, andwas an important source of annual additions to the <strong>USNH</strong> endowment.Chart 5 shows the change in <strong>USNH</strong> endowment and similar asset balancesover the past ten years. The State of New Hampshire adopted the UniformPrudent Management of Institutional Funds Act (UPMIFA) in 2009. Asa result of this new legislation, both <strong>USNH</strong> and UNHF updated theirendowment spending policies to allow payout from underwater trueendowment funds beginning in 2010. Management capped the <strong>USNH</strong>endowment payout-for-purpose in <strong>2011</strong> and 2010 at 85% of the 2009payout-per-unit level to mitigate the impact of the 2009 losses on theinvestment valuations, and will maintain this level for 2012 as well.<strong>USNH</strong>’s non-endowment operating investments generated positive returnsin <strong>2011</strong>. The <strong>2011</strong> earnings of $9.7 million compare to $14.7 million in 2010and a loss of $0.3 million in 2009. <strong>USNH</strong> revised its operating investmentguidelines and further diversified its operating investments in <strong>2011</strong> toensure preservation of capital and adequate liquidity.C. Cost Containment<strong>USNH</strong> has a long tradition of efficient operations, tight spending controls,balanced budgets, and now is committed to further reductions. As notedabove, <strong>USNH</strong> has put several measures in place in response to the dramaticgeneral appropriations decrease beginning in 2012. Employee separationexpenses totaled $6.3 million in <strong>2011</strong>. This compares to $0.8 million in2010. The majority of the <strong>2011</strong> costs were for separation incentives offeredby UNH. Targeted staff reductions are being implemented at all campusesin 2012 as well.Medical and dental costs net of employee cost sharing increased a total of7.8% in <strong>2011</strong>, in addition to increases of 6.7% in 2010 and 10.1% in 2009.The average annual increase over the past ten years was 7.2% per year. Inresponse to the continued increases in benefit costs, a full review of allsalary and benefit offerings called “Total Rewards” was conducted in <strong>2011</strong>including comparison with peer employers in the state and across thecountry. Specific benefit program changes to be implemented in 2012Chart 4: Awards for Competitive Sponsored Programs,UNH Only($ in millions)$180160140120100806040200$400350300250200150100502002 2003 2004 2005 2006 2007 2008 2009 2010 <strong>2011</strong>Chart 5: Total <strong>USNH</strong> Endowment & Similar Funds(includes UNHF & KEA)Ten-Year Growth($ in millions)0Accumulated market appreciationBook value of gifts and other additions2002 2003 2004 2005 2006 2007 2008 2009 2010 <strong>2011</strong>Chart 6: Uses of Total Revenue byFunctional Classification($ in millions)InstructionResearch and public serviceAuxiliary servicesStudent financial aidAcademic and student supportDepreciationOperations and maintenanceInstitutional support<strong>2011</strong> = $911 Total2010 = $857 TotalInterest expense2009 = $803 TotalFundraisingVoluntary contribution to stateOperating margin*$0 50 100 150 200 250*Used to pay principal on debt, support plant acquistions/renovations, and supplement net assets.17