2011 Annual Report - USNH Financial Services - University System ...
2011 Annual Report - USNH Financial Services - University System ...
2011 Annual Report - USNH Financial Services - University System ...

Create successful ePaper yourself
Turn your PDF publications into a flip-book with our unique Google optimized e-Paper software.
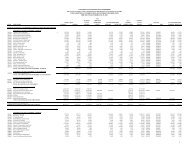
<strong>USNH</strong> <strong>2011</strong> ANNUAL REPORTTable 6: Summary Information Derived from theStatement of Revenues, Expenses and Changes in Net Assetsfor the Years Ended June 30($ in millions)2007 2008 2009 2010 <strong>2011</strong>Operating revenue, net $515) $548) $570) $592) $634)Operating expenses (602) (644) (670) (685) (742)Other revenues (expenses), net 128) 116) 125) 110) 135)Net income fromrecurring activities 41) 20) 25) 17) 27)Capital appropriations andother plant changes, net 14) 29) 37) 31) 30)Endowment gifts and unutilizedtotal returns, net 40) (11) (64) 25) 56)Other changes in net assets (2) (7) )Net increase (decrease) innet assets $ 95) $ 36) $ (9) $ 73) $113)The net income from recurring activities is further broken down into operating revenues, operatingexpenses, and other revenues (expenses).Generally, operating revenues are earned by <strong>USNH</strong> in exchange for providing goods and services.Operating expenses are defined as expenses incurred in the normal operation of the <strong>University</strong><strong>System</strong>, including a provision for estimated depreciation on property and equipment assets. GASBreporting standards require certain significant recurring revenues to be shown as nonoperating,including state general appropriations, Federal Pell grants, noncapital gifts, operating investmentincome, and endowment return used in operations. These diversified revenue streams are criticallyimportant sources of funds used to supplement tuition and fees revenue in the delivery of <strong>USNH</strong>programs. In other words, the regular operating expenses of <strong>USNH</strong> are funded in part by revenues notshown as operating revenues under GASB formats. As a result, operating revenues for <strong>2011</strong> were $119million greater than four years prior whereas operating expenses increased $140 million during thesame period.Other revenues (expenses) for <strong>2011</strong> increased by $7 million over 2007 and include stateappropriations, Federal Pell grants, gifts, operating investment income, other investment income,endowment returns used in operations, other nonoperating revenue (expense), and net interestexpense. Other nonoperating expense for 2010 included a voluntary contribution to the State of NewHampshire to help mitigate fiscal issues at the state level. This was a one-time payment (see Note 15for additional information in this regard). The result was a decline in the operating margin from $25million in 2009 to $17 million in 2010. In <strong>2011</strong>, the operating margin rebounded to $27 million.Table 7: Summary Information Derived from theStatement of Cash Flows for the Years Ended June 30($ in millions)2007 2008 2009 2010 <strong>2011</strong>Cash flows provided by (used in):Operating activities $(48) $(62) $(55) $(46) $(48)Noncapital financing activities 113) 118) 121) 104) 134)Capital financing activities (118) (46) (78) (54) (35)Investing activities 73) 24) 28) 44) 5)Increase in cash and cashequivalents 20) 34) 16) 48 56Increase (decrease) in current andlong-term operating investments 4) (35) (22) (5) (17)Change in cash, cash equivalentsand operating investments $ 24) $ (1) $ (6) $ 43) $ 39)Capital appropriations and other plant changesincreased net assets by $30 million in <strong>2011</strong>,primarily due to KEEP-NH as shown in Table 4.Endowment gifts and unutilized return totalof $56 million in <strong>2011</strong> includes new gifts of $9million, investment gains of $60 million, anddistributions totaling $13 million as detailed inTable 5.C. Statement of Cash FlowsThe Statement of Cash Flows summarizestransactions affecting cash and cash equivalentsduring the fiscal period. Table 7 shows summaryinformation derived from the Statement of CashFlows for the five years ended June 30, <strong>2011</strong>.Cash flows from operating activities will alwaysbe different from the operating loss on theStatement of Revenues, Expenses and Changesin Net Assets because of noncash items, suchas depreciation expense, and because the latterstatement is prepared on the accrual basis ofaccounting, meaning that it shows revenueswhen earned and expenses as incurred. Thedirect method of the Statement of Cash Flows,on the other hand, shows cash inflows andoutflows. The primary purpose of the Statementof Cash Flows is to provide relevant informationabout the cash receipts and cash payments of<strong>USNH</strong> during the year. In addition, it should helpreaders assess the ability of <strong>USNH</strong> to generatethe future cash flows necessary to meet itsobligations and evaluate its potential foradditional financing.GASB requires that receipts for state generalappropriations and noncapital gifts be shownas cash flows from noncapital financingactivities. The reduction in cash provided bynoncapital financing activities in 2010 is dueto a $25 million voluntary contribution to theState of New Hampshire to assist with fiscaldifficulties at the state level. This was a one-timepayment and not a reduction of the generalappropriation revenue base (see Note 15 foradditional information in this regard). Includedin cash flows from capital financing activitiesare all plant funds and related long-term debtactivities, as well as gifts to the endowment.This includes KEEP-NH and NHHEFA bondconstruction amounts expended. Cash flowsfrom investing activities show all uses of cashand cash equivalents to purchase investments,and all cash and cash equivalents provided bythe sale of investments and income generatedfrom cash and investments owned. The netcash provided by investing activities is made upof bond investments sold to finance associatedconstruction expenditures and the conversionof short-term investments into cash equivalentsduring the year.22