<strong>USNH</strong> <strong>2011</strong> ANNUAL REPORTTable 6: Summary Information Derived from theStatement of Revenues, Expenses and Changes in Net Assetsfor the Years Ended June 30($ in millions)2007 2008 2009 2010 <strong>2011</strong>Operating revenue, net $515) $548) $570) $592) $634)Operating expenses (602) (644) (670) (685) (742)Other revenues (expenses), net 128) 116) 125) 110) 135)Net income fromrecurring activities 41) 20) 25) 17) 27)Capital appropriations andother plant changes, net 14) 29) 37) 31) 30)Endowment gifts and unutilizedtotal returns, net 40) (11) (64) 25) 56)Other changes in net assets (2) (7) )Net increase (decrease) innet assets $ 95) $ 36) $ (9) $ 73) $113)The net income from recurring activities is further broken down into operating revenues, operatingexpenses, and other revenues (expenses).Generally, operating revenues are earned by <strong>USNH</strong> in exchange for providing goods and services.Operating expenses are defined as expenses incurred in the normal operation of the <strong>University</strong><strong>System</strong>, including a provision for estimated depreciation on property and equipment assets. GASBreporting standards require certain significant recurring revenues to be shown as nonoperating,including state general appropriations, Federal Pell grants, noncapital gifts, operating investmentincome, and endowment return used in operations. These diversified revenue streams are criticallyimportant sources of funds used to supplement tuition and fees revenue in the delivery of <strong>USNH</strong>programs. In other words, the regular operating expenses of <strong>USNH</strong> are funded in part by revenues notshown as operating revenues under GASB formats. As a result, operating revenues for <strong>2011</strong> were $119million greater than four years prior whereas operating expenses increased $140 million during thesame period.Other revenues (expenses) for <strong>2011</strong> increased by $7 million over 2007 and include stateappropriations, Federal Pell grants, gifts, operating investment income, other investment income,endowment returns used in operations, other nonoperating revenue (expense), and net interestexpense. Other nonoperating expense for 2010 included a voluntary contribution to the State of NewHampshire to help mitigate fiscal issues at the state level. This was a one-time payment (see Note 15for additional information in this regard). The result was a decline in the operating margin from $25million in 2009 to $17 million in 2010. In <strong>2011</strong>, the operating margin rebounded to $27 million.Table 7: Summary Information Derived from theStatement of Cash Flows for the Years Ended June 30($ in millions)2007 2008 2009 2010 <strong>2011</strong>Cash flows provided by (used in):Operating activities $(48) $(62) $(55) $(46) $(48)Noncapital financing activities 113) 118) 121) 104) 134)Capital financing activities (118) (46) (78) (54) (35)Investing activities 73) 24) 28) 44) 5)Increase in cash and cashequivalents 20) 34) 16) 48 56Increase (decrease) in current andlong-term operating investments 4) (35) (22) (5) (17)Change in cash, cash equivalentsand operating investments $ 24) $ (1) $ (6) $ 43) $ 39)Capital appropriations and other plant changesincreased net assets by $30 million in <strong>2011</strong>,primarily due to KEEP-NH as shown in Table 4.Endowment gifts and unutilized return totalof $56 million in <strong>2011</strong> includes new gifts of $9million, investment gains of $60 million, anddistributions totaling $13 million as detailed inTable 5.C. Statement of Cash FlowsThe Statement of Cash Flows summarizestransactions affecting cash and cash equivalentsduring the fiscal period. Table 7 shows summaryinformation derived from the Statement of CashFlows for the five years ended June 30, <strong>2011</strong>.Cash flows from operating activities will alwaysbe different from the operating loss on theStatement of Revenues, Expenses and Changesin Net Assets because of noncash items, suchas depreciation expense, and because the latterstatement is prepared on the accrual basis ofaccounting, meaning that it shows revenueswhen earned and expenses as incurred. Thedirect method of the Statement of Cash Flows,on the other hand, shows cash inflows andoutflows. The primary purpose of the Statementof Cash Flows is to provide relevant informationabout the cash receipts and cash payments of<strong>USNH</strong> during the year. In addition, it should helpreaders assess the ability of <strong>USNH</strong> to generatethe future cash flows necessary to meet itsobligations and evaluate its potential foradditional financing.GASB requires that receipts for state generalappropriations and noncapital gifts be shownas cash flows from noncapital financingactivities. The reduction in cash provided bynoncapital financing activities in 2010 is dueto a $25 million voluntary contribution to theState of New Hampshire to assist with fiscaldifficulties at the state level. This was a one-timepayment and not a reduction of the generalappropriation revenue base (see Note 15 foradditional information in this regard). Includedin cash flows from capital financing activitiesare all plant funds and related long-term debtactivities, as well as gifts to the endowment.This includes KEEP-NH and NHHEFA bondconstruction amounts expended. Cash flowsfrom investing activities show all uses of cashand cash equivalents to purchase investments,and all cash and cash equivalents provided bythe sale of investments and income generatedfrom cash and investments owned. The netcash provided by investing activities is made upof bond investments sold to finance associatedconstruction expenditures and the conversionof short-term investments into cash equivalentsduring the year.22
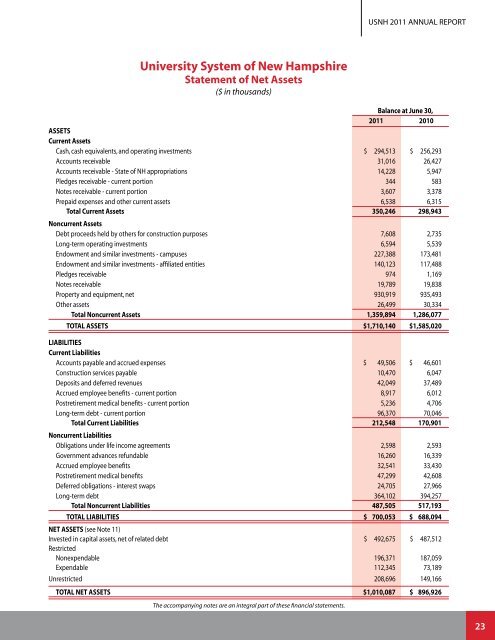
<strong>USNH</strong> <strong>2011</strong> ANNUAL REPORT<strong>University</strong> <strong>System</strong> of New HampshireStatement of Net Assets($ in thousands)Balance at June 30,<strong>2011</strong> 2010ASSETSCurrent AssetsCash, cash equivalents, and operating investments $ 294,513 $ 256,293Accounts receivable 31,016 26,427Accounts receivable - State of NH appropriations 14,228 5,947Pledges receivable - current portion 344 583Notes receivable - current portion 3,607 3,378Prepaid expenses and other current assets 6,538 6,315Total Current Assets 350,246 298,943Noncurrent AssetsDebt proceeds held by others for construction purposes 7,608 2,735Long-term operating investments 6,594 5,539Endowment and similar investments - campuses 227,388 173,481Endowment and similar investments - affiliated entities 140,123 117,488Pledges receivable 974 1,169Notes receivable 19,789 19,838Property and equipment, net 930,919 935,493Other assets 26,499 30,334Total Noncurrent Assets 1,359,894 1,286,077TOTAL ASSETS $1,710,140 $1,585,020LIABILITIESCurrent LiabilitiesAccounts payable and accrued expenses $ 49,506 $ 46,601Construction services payable 10,470 6,047Deposits and deferred revenues 42,049 37,489Accrued employee benefits - current portion 8,917 6,012Postretirement medical benefits - current portion 5,236 4,706Long-term debt - current portion 96,370 70,046Total Current Liabilities 212,548 170,901Noncurrent LiabilitiesObligations under life income agreements 2,598 2,593Government advances refundable 16,260 16,339Accrued employee benefits 32,541 33,430Postretirement medical benefits 47,299 42,608Deferred obligations - interest swaps 24,705 27,966Long-term debt 364,102 394,257Total Noncurrent Liabilities 487,505 517,193TOTAL LIABILITIES $ 700,053 $ 688,094NET ASSETS (see Note 11)Invested in capital assets, net of related debt $ 492,675 $ 487,512RestrictedNonexpendable 196,371 187,059Expendable 112,345 73,189Unrestricted 208,696 149,166TOTAL NET ASSETS $1,010,087 $ 896,926The accompanying notes are an integral part of these financial statements.23