2011 Annual Report - USNH Financial Services - University System ...
2011 Annual Report - USNH Financial Services - University System ...
2011 Annual Report - USNH Financial Services - University System ...

Create successful ePaper yourself
Turn your PDF publications into a flip-book with our unique Google optimized e-Paper software.
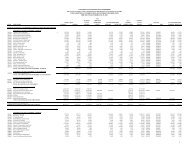
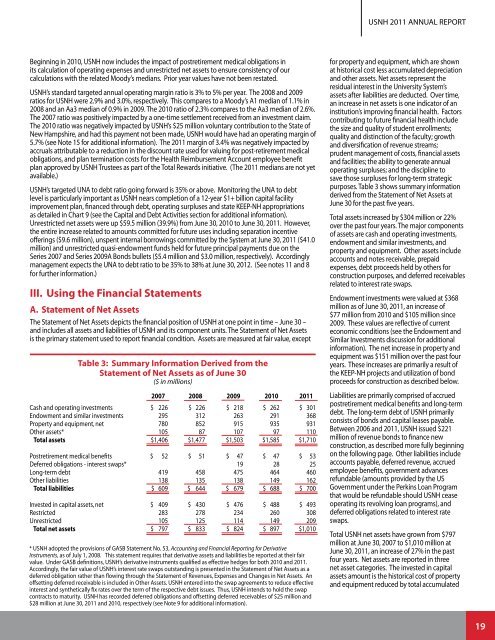
<strong>USNH</strong> <strong>2011</strong> ANNUAL REPORTBeginning in 2010, <strong>USNH</strong> now includes the impact of postretirement medical obligations inits calculation of operating expenses and unrestricted net assets to ensure consistency of ourcalculations with the related Moody’s medians. Prior year values have not been restated.<strong>USNH</strong>’s standard targeted annual operating margin ratio is 3% to 5% per year. The 2008 and 2009ratios for <strong>USNH</strong> were 2.9% and 3.0%, respectively. This compares to a Moody’s A1 median of 1.1% in2008 and an Aa3 median of 0.9% in 2009. The 2010 ratio of 2.3% compares to the Aa3 median of 2.6%.The 2007 ratio was positively impacted by a one-time settlement received from an investment claim.The 2010 ratio was negatively impacted by <strong>USNH</strong>’s $25 million voluntary contribution to the State ofNew Hampshire, and had this payment not been made, <strong>USNH</strong> would have had an operating margin of5.7% (see Note 15 for additional information). The <strong>2011</strong> margin of 3.4% was negatively impacted byaccruals attributable to a reduction in the discount rate used for valuing for post-retirement medicalobligations, and plan termination costs for the Health Reimbursement Account employee benefitplan approved by <strong>USNH</strong> Trustees as part of the Total Rewards initiative. (The <strong>2011</strong> medians are not yetavailable.)<strong>USNH</strong>’s targeted UNA to debt ratio going forward is 35% or above. Monitoring the UNA to debtlevel is particularly important as <strong>USNH</strong> nears completion of a 12-year $1+ billion capital facilityimprovement plan, financed through debt, operating surpluses and state KEEP-NH appropriationsas detailed in Chart 9 (see the Capital and Debt Activities section for additional information).Unrestricted net assets were up $59.5 million (39.9%) from June 30, 2010 to June 30, <strong>2011</strong>. However,the entire increase related to amounts committed for future uses including separation incentiveofferings ($9.6 million), unspent internal borrowings committed by the <strong>System</strong> at June 30, <strong>2011</strong> ($41.0million) and unrestricted quasi-endowment funds held for future principal payments due on theSeries 2007 and Series 2009A Bonds bullets ($5.4 million and $3.0 million, respectively). Accordinglymanagement expects the UNA to debt ratio to be 35% to 38% at June 30, 2012. (See notes 11 and 8for further information.)III. Using the <strong>Financial</strong> StatementsA. Statement of Net AssetsThe Statement of Net Assets depicts the financial position of <strong>USNH</strong> at one point in time – June 30 –and includes all assets and liabilities of <strong>USNH</strong> and its component units. The Statement of Net Assetsis the primary statement used to report financial condition. Assets are measured at fair value, exceptTable 3: Summary Information Derived from theStatement of Net Assets as of June 30($ in millions)2007 2008 2009 2010 <strong>2011</strong>Cash and operating investments $ 226 $ 226 $ 218 $ 262 $ 301Endowment and similar investments 295 312 263 291 368Property and equipment, net 780 852 915 935 931Other assets* 105 87 107 97 110Total assets $1,406 $1,477 $1,503 $1,585 $1,710Postretirement medical benefits $ 52 $ 51 $ 47 $ 47 $ 53Deferred obligations - interest swaps* 19 28 25Long-term debt 419 458 475 464 460Other liabilities 138 135 138 149 162Total liabilities $ 609 $ 644 $ 679 $ 688 $ 700Invested in capital assets, net $ 409 $ 430 $ 476 $ 488 $ 493Restricted 283 278 234 260 308Unrestricted 105 125 114 149 209Total net assets $ 797 $ 833 $ 824 $ 897 $1,010* <strong>USNH</strong> adopted the provisions of GASB Statement No. 53, Accounting and <strong>Financial</strong> <strong>Report</strong>ing for DerivativeInstruments, as of July 1, 2008. This statement requires that derivative assets and liabilities be reported at their fairvalue. Under GASB definitions, <strong>USNH</strong>’s derivative instruments qualified as effective hedges for both 2010 and <strong>2011</strong>.Accordingly, the fair value of <strong>USNH</strong>’s interest rate swaps outstanding is presented in the Statement of Net Assets as adeferred obligation rather than flowing through the Statement of Revenues, Expenses and Changes in Net Assets. Anoffsetting deferred receivable is included in Other Assets. <strong>USNH</strong> entered into the swap agreements to reduce effectiveinterest and synthetically fix rates over the term of the respective debt issues. Thus, <strong>USNH</strong> intends to hold the swapcontracts to maturity. <strong>USNH</strong> has recorded deferred obligations and offsetting deferred receivables of $25 million and$28 million at June 30, <strong>2011</strong> and 2010, respectively (see Note 9 for additional information).for property and equipment, which are shownat historical cost less accumulated depreciationand other assets. Net assets represent theresidual interest in the <strong>University</strong> <strong>System</strong>’sassets after liabilities are deducted. Over time,an increase in net assets is one indicator of aninstitution’s improving financial health. Factorscontributing to future financial health includethe size and quality of student enrollments;quality and distinction of the faculty; growthand diversification of revenue streams;prudent management of costs, financial assetsand facilities; the ability to generate annualoperating surpluses; and the discipline tosave those surpluses for long-term strategicpurposes. Table 3 shows summary informationderived from the Statement of Net Assets atJune 30 for the past five years.Total assets increased by $304 million or 22%over the past four years. The major componentsof assets are cash and operating investments,endowment and similar investments, andproperty and equipment. Other assets includeaccounts and notes receivable, prepaidexpenses, debt proceeds held by others forconstruction purposes, and deferred receivablesrelated to interest rate swaps.Endowment investments were valued at $368million as of June 30, <strong>2011</strong>, an increase of$77 million from 2010 and $105 million since2009. These values are reflective of currenteconomic conditions (see the Endowment andSimilar Investments discussion for additionalinformation). The net increase in property andequipment was $151 million over the past fouryears. These increases are primarily a result ofthe KEEP-NH projects and utilization of bondproceeds for construction as described below.Liabilities are primarily comprised of accruedpostretirement medical benefits and long-termdebt. The long-term debt of <strong>USNH</strong> primarilyconsists of bonds and capital leases payable.Between 2006 and <strong>2011</strong>, <strong>USNH</strong> issued $221million of revenue bonds to finance newconstruction, as described more fully beginningon the following page. Other liabilities includeaccounts payable, deferred revenue, accruedemployee benefits, government advancesrefundable (amounts provided by the USGovernment under the Perkins Loan Programthat would be refundable should <strong>USNH</strong> ceaseoperating its revolving loan programs), anddeferred obligations related to interest rateswaps.Total <strong>USNH</strong> net assets have grown from $797million at June 30, 2007 to $1,010 million atJune 30, <strong>2011</strong>, an increase of 27% in the pastfour years. Net assets are reported in threenet asset categories. The invested in capitalassets amount is the historical cost of propertyand equipment reduced by total accumulated19