- Page 1 and 2:
TÜİKİSTATİSTİKGÖSTERGELERStat
- Page 3 and 4: İSTATİSTİK GÖSTERGELER19232009S
- Page 5 and 6: İÇİNDEKİLERCONTENTSÖnsözİçi
- Page 7 and 8: Uluslararası Para FonuIMFInternati
- Page 9 and 10: 1.21 Cinsiyete göre nüfusun okury
- Page 11 and 12: Yaş: Kişinin bitirmiş (tamamlam
- Page 13 and 14: (Milyon-Million)501.3 Yaş gruplar
- Page 15 and 16: 1.1 Nüfus, yıllık nüfus artış
- Page 17 and 18: 1.5 Cinsiyete göre il/ilçe merkez
- Page 19 and 20: 1.6 Cinsiyet ve yaş gruplarına g
- Page 21 and 22: 1.8 Yaş bağımlılık oranıAge d
- Page 23 and 24: 1.12 Medeni durum ve cinsiyete gör
- Page 25 and 26: 1.15 Yetişkin nüfusun cinsiyet ve
- Page 27 and 28: 1.19 Cinsiyet ve okuryazarlık duru
- Page 29 and 30: 1.23 Ekonomik faaliyet ve cinsiyete
- Page 31 and 32: 1.24 Ekonomik faaliyet ve cinsiyete
- Page 33 and 34: 1.25 İşgücü durumu ve cinsiyete
- Page 35 and 36: 1.27 Yaş grubu ve cinsiyete göre
- Page 37 and 38: HAYATİ İSTATİSTİKLERBu bölümd
- Page 39 and 40: (Onbinde - Perten thousand)2.1 Kaba
- Page 41 and 42: (Kişi - Persons)2.5 İntihar sayı
- Page 43 and 44: 2.2 Boşanma sayısı ve kaba boşa
- Page 45 and 46: 2.3 Evlilik süresine göre boşanm
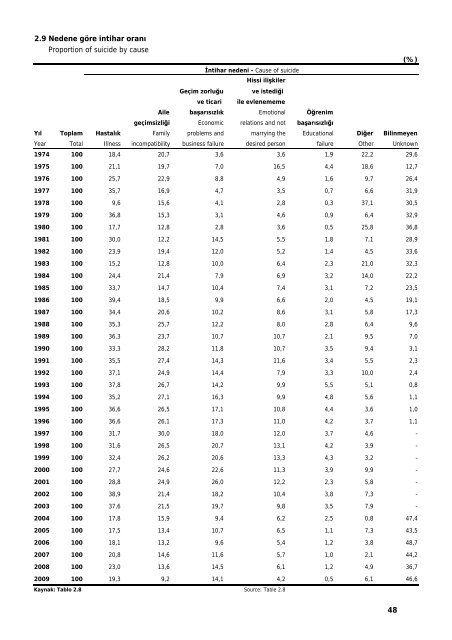
- Page 47 and 48: 2.4 Nedene göre boşanmalar (devam
- Page 49 and 50: 2.5 Cinsiyet ve yaş grubuna göre
- Page 51 and 52: 2.6 Cinsiyet ve yaş grubuna göre
- Page 53: 2.7 Cinsiyete göre intiharlar ve k
- Page 57 and 58: SayfaPageAçıklama 51 ExplanationG
- Page 59 and 60: 3.1 Hekim başına düşen kişi sa
- Page 61 and 62: 3.1 Yataklı ve yataksız sağlık
- Page 63 and 64: 3.3 Türlerine göre hastane sayıs
- Page 65 and 66: 3.5 Kamu ve özel yataklı sağlık
- Page 67 and 68: 3.7 Eczane ve eczacı sayısıNumbe
- Page 69 and 70: SayfaPageAçıklama 63 ExplanationG
- Page 71 and 72: (Öğrenci sayısı-Number of stude
- Page 73 and 74: 4.5 Okul başına düşen öğrenci
- Page 75 and 76: 4.1 İlkokul ve İlköğretim okull
- Page 77 and 78: 4.2 Genel ortaokullarda okul ve cin
- Page 79 and 80: 4.3 Genel liselerde okul ve cinsiye
- Page 81 and 82: 4.4 Mesleki ve teknik okullarda oku
- Page 83 and 84: 4.5 Yükseköğretim kurumlarında
- Page 85 and 86: 4.6 Okul başına düşen öğrenci
- Page 87 and 88: 4.7 Öğretmen başına düşen ö
- Page 89 and 90: KÜLTÜRBu bölümdeki kültür ist
- Page 91 and 92: 5.3 Sinema salonu sayısıNumber of
- Page 93 and 94: 5.2 Konularına göre yıl içinde
- Page 95 and 96: 5.4 Gazetelerin ve dergilerin yayı
- Page 97 and 98: 5.6 Opera, bale ve tiyatro faaliyet
- Page 99 and 100: 5.8 Sinema, gösterilen film ve sey
- Page 101 and 102: ADALETBu bölümdeki hukuk ve ceza
- Page 103 and 104: 6.3 Hakim başına düşen dava say
- Page 105 and 106:
6.1 Adalet personeli sayısıNumber
- Page 107 and 108:
6.3 Cinsiyete göre ceza infaz kuru
- Page 109 and 110:
6.4 Yaş grubuna göre ceza infaz k
- Page 111 and 112:
6.6 Okuryazarlık durumuna göre ce
- Page 113 and 114:
6.7 Eğitim durumuna göre ceza inf
- Page 115 and 116:
6.9 Meslek grubuna göre ceza infaz
- Page 117 and 118:
6.9 Meslek grubuna göre ceza infaz
- Page 119 and 120:
SayfaPageAçıklama 113 Explanation
- Page 121 and 122:
7.1 Milletvekili seçimleriNational
- Page 123 and 124:
7.1 Milletvekili genel seçimi sonu
- Page 125 and 126:
7.2 Milletvekili genel seçimi sonu
- Page 127 and 128:
7.3 Milletvekili genel seçimi sonu
- Page 129 and 130:
7.4 Mahalli idareler, il genel mecl
- Page 131 and 132:
7.5 Mahalli idareler, belediye baş
- Page 133 and 134:
7.6 Mahalli idareler, belediye mecl
- Page 135 and 136:
SayfaPageAçıklama 129 Explanation
- Page 137 and 138:
Tanım ve KavramlarKurumsal olmayan
- Page 139 and 140:
8.3 Genel bütçeli kuruluşlardaki
- Page 141 and 142:
8.2 İşgücü durumuna göre kurum
- Page 143 and 144:
8.4 Ekonomik faaliyet koluna göre
- Page 145 and 146:
8.5 Eğitim durumlarına göre iş
- Page 147 and 148:
8.7 Meslek gruplarına göre istihd
- Page 149 and 150:
8.8 İşteki duruma göre istihdam
- Page 151 and 152:
8.10 İşyerinde çalışan kişi s
- Page 153 and 154:
8.12 Aranılan meslek türüne gör
- Page 155 and 156:
8.13 İş arama sürelerine göre i
- Page 157 and 158:
8.15 İşgücüne dahil olmama nede
- Page 159 and 160:
8.17 Genel bütçeli kuruluşlardak
- Page 161 and 162:
8.18 Özel bütçeli kuruluşlardak
- Page 163 and 164:
TARIMÜlkemizin tarımsal varlığ
- Page 165 and 166:
24(Milyon ton - Million tons)9.1 Se
- Page 167 and 168:
Milyon ton-Million tons9.5 Süt ür
- Page 169 and 170:
9.1 İşletme büyüklüğüne gör
- Page 171 and 172:
9.1 İşletme büyüklüğüne gör
- Page 173 and 174:
9.3 Seçilmiş tahılların ekilen
- Page 175 and 176:
9.5 Seçilmiş baklagillerin ekilen
- Page 177 and 178:
9.7 Seçilmiş yağlı tohumların
- Page 179 and 180:
9.9 Seçilmiş diğer bitkisel ür
- Page 181 and 182:
9.11 Seçilmiş tahıllar ve diğer
- Page 183 and 184:
9.11 Seçilmiş tahıllar ve diğer
- Page 185 and 186:
9.12 Seçilmiş sebzelerin üretimi
- Page 187 and 188:
9.13 Seçilmiş meyve veren ağaç
- Page 189 and 190:
9.14 Seçilmiş meyvelerin üretimi
- Page 191 and 192:
9.15 Sert kabuklu meyve veren ağa
- Page 193 and 194:
9.16 Sert kabuklu meyvelerin üreti
- Page 195 and 196:
9.17 Turunçgiller meyve veren ağa
- Page 197 and 198:
9.18 Turunçgillerin üretimiProduc
- Page 199 and 200:
9.19 Seçilmiş tarımsal alet ve m
- Page 201 and 202:
9.20 Canlı hayvanlar (devam)Livest
- Page 203 and 204:
9.21 Süt üretimi (devam)Milk prod
- Page 205 and 206:
9.22 Et üretimi (devam)Meat produc
- Page 207 and 208:
9.23 Arıcılık ve ipekböcekçili
- Page 209 and 210:
9.25 Kümes hayvanları sayısı ve
- Page 211 and 212:
9.26 Çiftçinin eline geçen fiyat
- Page 213 and 214:
9.26 Çiftçinin eline geçen fiyat
- Page 215 and 216:
9.26 Çiftçinin eline geçen fiyat
- Page 217 and 218:
9.26 Çiftçinin eline geçen fiyat
- Page 219 and 220:
9.26 Çiftçinin eline geçen fiyat
- Page 221 and 222:
9.26 Çiftçinin eline geçen fiyat
- Page 223 and 224:
9.26 Çiftçinin eline geçen fiyat
- Page 225 and 226:
ENERJİBu bölümdeki birincil ener
- Page 227 and 228:
180(Milyar kWh-Billions kWh)10.3 El
- Page 229 and 230:
10.2 Elektrik santrallarında kurul
- Page 231 and 232:
10.3 Santrallara göre elektrik ene
- Page 233 and 234:
10.4 Birincil enerji üretimiPrimar
- Page 235 and 236:
10.5 Birincil enerji üretimi (deva
- Page 237 and 238:
SayfaPageAçıklama 232 Explanation
- Page 239 and 240:
İMALAT SANAYİMANUFACTURING INDUST
- Page 241 and 242:
6. Çıktı : Satışlar ve başkal
- Page 243 and 244:
2003, 2004, 2005 ve 2006 Yıllık S
- Page 245 and 246:
YöntemYıllık Sanayi Ürün İsta
- Page 247 and 248:
TANIM VE KAVRAMLARUlusal yayın kur
- Page 249 and 250:
(Milyon ton -Million tons)565248444
- Page 251 and 252:
(Milyon litre-Million liters)4011.7
- Page 253 and 254:
(Bin adet -Thousand units)11.11 Ça
- Page 255 and 256:
11.15 Kağıt, kağıt ürünleri i
- Page 257 and 258:
11.2 İmalat sanayii, devlet sektö
- Page 259 and 260:
11.4 İmalat sanayiinde; işyeri, i
- Page 261 and 262:
11.6 Dokuma, giyim eşyası ve deri
- Page 263 and 264:
11.8 Kağıt, kağıt ürünleri ve
- Page 265 and 266:
11.10 Taş ve toprağa dayalı sana
- Page 267 and 268:
11.12 Metal eşya, makina ve teçhi
- Page 269 and 270:
11.14 Girişim bazında temel göst
- Page 271 and 272:
11.14 Girişim bazında temel göst
- Page 273 and 274:
11.14 Girişim bazında temel göst
- Page 275 and 276:
11.14 Girişim bazında temel göst
- Page 277 and 278:
11.14 Girişim bazında temel göst
- Page 279 and 280:
11.14 Girişim bazında temel göst
- Page 281 and 282:
11.14 Girişim bazında temel göst
- Page 283 and 284:
11.15 Petrol ürünleri üretimiPro
- Page 285 and 286:
11.17 Şeker, çimento ve kağıt m
- Page 287 and 288:
11.19 Alkollü içkiler üretimiAlc
- Page 289 and 290:
11.21 Gübre sanayii üretimiFertil
- Page 291 and 292:
11.23 Demir çelik sanayii üretimi
- Page 293 and 294:
11.25 Motorlu kara taşıt ulaşım
- Page 295 and 296:
11.27 Dayanıklı tüketim malları
- Page 297 and 298:
11.29 İmalat sanayiinde kapasite k
- Page 299 and 300:
11.31 İmalat sanayiinde kapasite k
- Page 301 and 302:
11.32 İmalat sanayiinde kapasite k
- Page 303 and 304:
11.32 İmalat sanayiinde kapasite k
- Page 305 and 306:
11.33 Sanayi üretim endeksiIndustr
- Page 307 and 308:
11.33 Sanayi üretim endeksi (devam
- Page 309 and 310:
11.34 Sanayi üretim endeksi (devam
- Page 311 and 312:
11.35 Sanayi üretim endeksi deği
- Page 313 and 314:
11.35 Sanayi üretim endeksi deği
- Page 315 and 316:
11.36 Sanayi sektöründe faaliyeti
- Page 317 and 318:
11.37 Mali aracı kuruluşların ek
- Page 319 and 320:
11.37 Mali aracı kuruluşların ek
- Page 321 and 322:
11.37 Mali aracı kuruluşların ek
- Page 323 and 324:
11.37 Mali aracı kuruluşların ek
- Page 325 and 326:
11.37 Mali aracı kuruluşların ek
- Page 327 and 328:
11.37 Mali aracı kuruluşların ek
- Page 329 and 330:
11.37 Mali aracı kuruluşların ek
- Page 331 and 332:
11.37 Mali aracı kuruluşların ek
- Page 333 and 334:
11.37 Mali aracı kuruluşların ek
- Page 335 and 336:
11.37 Mali aracı kuruluşların ek
- Page 337 and 338:
11.37 Mali aracı kuruluşların ek
- Page 339 and 340:
11.38 Yayın kurumu sayısı, istih
- Page 341 and 342:
11.38 Yayın kurumu sayısı, istih
- Page 343 and 344:
11.38 Yayın kurumu sayısı, istih
- Page 345 and 346:
11.39 Yayın türlerine göre bazı
- Page 347 and 348:
11.39 Yayın türlerine göre bazı
- Page 349 and 350:
11.39 Yayın türlerine göre bazı
- Page 351 and 352:
BİNA iNŞAATIYapı İzinleriTÜİK
- Page 353 and 354:
Oda: Döşemeden tavana kadar dört
- Page 355 and 356:
12.1 İnşaatı biten yapılarBuild
- Page 357 and 358:
12.5 Yapı kooperatiflerince yapıl
- Page 359 and 360:
12.2 Kullanma amacına göre tamame
- Page 361 and 362:
12.2 Kullanma amacına göre tamame
- Page 363 and 364:
12.3 Kullanma amacına göre yapıl
- Page 365 and 366:
12.4 Yapı kooperatifleri tarafınd
- Page 367 and 368:
12.6 İkamet amaçlı binaların sa
- Page 369 and 370:
ULAŞTIRMA VE HABERLEŞMEBu bölüm
- Page 371 and 372:
(Bin - Thousand)13.1 Karayolu trafi
- Page 373 and 374:
13.5 Hava meydanlarında toplam yol
- Page 375 and 376:
13.2 Köy yolları uzunluklarıLeng
- Page 377 and 378:
13.4 Cinslerine göre motorlu kara
- Page 379 and 380:
13.5 Karayolu trafik kazalarıRoad
- Page 381 and 382:
13.7 Hava meydanlarında toplam yol
- Page 383 and 384:
13.9 Yurt içi ve yurt dışı post
- Page 385 and 386:
13.10 Posta yolları uzunluğuLengt
- Page 387 and 388:
13.11 Karayolu posta hatları sayı
- Page 389 and 390:
13.12 Telefon abone sayısı, telgr
- Page 391 and 392:
13.13 Limanlara giren ve çıkan ge
- Page 393 and 394:
TURİZMBu bölümdeki veriler Türk
- Page 395 and 396:
14.1 Dış ülkelere giden vatanda
- Page 397 and 398:
(Bin - Thousand)7 0006 5006 0005 50
- Page 399 and 400:
14.9 Turizm işletmesi belgeli kona
- Page 401 and 402:
14.2 Geliş amaçlarına göre gide
- Page 403 and 404:
14.4 Yararlandıkları taşıt çe
- Page 405 and 406:
14.6 Dış yolculuk gelir ve giderl
- Page 407 and 408:
14.8 Turizm yatırım belgeli konak
- Page 409 and 410:
ŞİRKETLER, KOOPERATİFLER VE TİC
- Page 411 and 412:
15.3 Madencilik ve taşocakçılı
- Page 413 and 414:
Kurulan-Established(Bin-Thousand)60
- Page 415 and 416:
15.2 Yeni kurulan, sermayeleri değ
- Page 417 and 418:
15.3 Ekonomik faaliyet kollarına g
- Page 419 and 420:
15.4 Ekonomik faaliyet kollarına g
- Page 421 and 422:
15.5 Ekonomik faaliyet kollarına g
- Page 423 and 424:
15.6 Ekonomik faaliyet kollarına g
- Page 425 and 426:
15.7 Ekonomik faaliyet kollarına g
- Page 427 and 428:
15.8 Ekonomik faaliyet kollarına g
- Page 429 and 430:
DIŞ TİCARETBu bölümdeki veriler
- Page 431 and 432:
(Milyar $-Billion $)16.1 İhracat v
- Page 433 and 434:
(%)16.5 Ekonomik faaliyetlere göre
- Page 435 and 436:
(%)3016.9 Seçilmiş ülkelere yap
- Page 437 and 438:
(Milyon $-Million $)5 00016.13 Cari
- Page 439 and 440:
16.1 İthalat ve ihracat (devam)Imp
- Page 441 and 442:
16.2 Dış ticaret göstergeleri (d
- Page 443 and 444:
16.3 Standart uluslararası ticaret
- Page 445 and 446:
16.4 Standart uluslararası ticaret
- Page 447 and 448:
16.6 Geniş ekonomik grupların sı
- Page 449 and 450:
16.7 İhracat fiyat endeksi (Eski s
- Page 451 and 452:
16.9 İhracat miktar endeksi (Eski
- Page 453 and 454:
16.11 Ekonomik faaliyetlere göre d
- Page 455 and 456:
16.12 Seçilmiş ülkelere yapılan
- Page 457 and 458:
16.12 Seçilmiş ülkelere yapılan
- Page 459 and 460:
16.12 Seçilmiş ülkelere yapılan
- Page 461 and 462:
16.12 Seçilmiş ülkelere yapılan
- Page 463 and 464:
16.13 Seçilmiş ülkelerden yapıl
- Page 465 and 466:
16.13 Seçilmiş ülkelerden yapıl
- Page 467 and 468:
16.13 Seçilmiş ülkelerden yapıl
- Page 469 and 470:
16.13 Seçilmiş ülkelerden yapıl
- Page 471 and 472:
16.14 Ödemeler dengesi (Eski seri)
- Page 473 and 474:
16.14 Ödemeler dengesi (Eski seri)
- Page 475 and 476:
16.14 Ödemeler dengesi (Eski seri)
- Page 477 and 478:
16.14 Ödemeler dengesi (Eski seri)
- Page 479 and 480:
16.14 Ödemeler dengesi (Eski seri)
- Page 481 and 482:
16.14 Ödemeler dengesi (Yeni seri)
- Page 483 and 484:
16.14 Ödemeler dengesi (Yeni seri)
- Page 485 and 486:
16.14 Ödemeler dengesi (Yeni seri)
- Page 487 and 488:
16.14 Ödemeler dengesi (Yeni seri)
- Page 489 and 490:
16.14 Ödemeler dengesi (Yeni seri)
- Page 491 and 492:
SayfaPageAçıklama 485 Explanation
- Page 493 and 494:
Ekonomik, sosyal ve kültürel aç
- Page 495 and 496:
(%)17.1 Ankara şehri tüketici fiy
- Page 497 and 498:
17.1 Seçilmiş gıda maddelerinin
- Page 499 and 500:
17.1 Seçilmiş gıda maddelerinin
- Page 501 and 502:
17.2 Seçilmiş gıda maddelerinin
- Page 503 and 504:
17.2 Seçilmiş gıda maddelerinin
- Page 505 and 506:
17.3 Toptan eşya fiyatları endeks
- Page 507 and 508:
17.3 Toptan eşya fiyatları endeks
- Page 509 and 510:
17.3 Toptan eşya fiyatları endeks
- Page 511 and 512:
17.3 Toptan eşya fiyatları endeks
- Page 513 and 514:
17.4 Toptan eşya fiyatları endeks
- Page 515 and 516:
17.4 Toptan eşya fiyatları endeks
- Page 517 and 518:
17.4 Toptan eşya fiyatları endeks
- Page 519 and 520:
17.4 Toptan eşya fiyatları endeks
- Page 521 and 522:
17.5 Toptan eşya fiyatları endeks
- Page 523 and 524:
17.5 Toptan eşya fiyatları endeks
- Page 525 and 526:
17.5 Toptan eşya fiyatları endeks
- Page 527 and 528:
17.5 Toptan eşya fiyatları endeks
- Page 529 and 530:
17.6 Toptan eşya fiyatları endeks
- Page 531 and 532:
17.6 Toptan eşya fiyatları endeks
- Page 533 and 534:
17.6 Toptan eşya fiyatları endeks
- Page 535 and 536:
17.6 Toptan eşya fiyatları endeks
- Page 537 and 538:
17.7 Toptan eşya fiyatları endeks
- Page 539 and 540:
17.7 Toptan eşya fiyatları endeks
- Page 541 and 542:
17.7 Toptan eşya fiyatları endeks
- Page 543 and 544:
17.8 Toptan eşya fiyatları endeks
- Page 545 and 546:
17.8 Toptan eşya fiyatları endeks
- Page 547 and 548:
17.8 Toptan eşya fiyatları endeks
- Page 549 and 550:
17.9 Fiyat endeksleri ve değişim
- Page 551 and 552:
17.10 Ankara tüketici fiyatları e
- Page 553 and 554:
17.11 İstanbul tüketici fiyatlar
- Page 555 and 556:
17.12 Ankara tüketici fiyatları e
- Page 557 and 558:
17.14 Türkiye tüketici fiyatları
- Page 559 and 560:
17.15 Türkiye tüketici fiyatları
- Page 561 and 562:
17.16 Fiyat endeksleri ve değişim
- Page 563 and 564:
17.19 Sektörlere göre üretici fi
- Page 565 and 566:
17.21 Bina inşaatı maliyet endeks
- Page 567 and 568:
PARA VE BANKATanım ve KavramlarBu
- Page 569 and 570:
(YTL - TRY)18.3 Döviz KurlarıExch
- Page 571 and 572:
(YTL/gr -TRY/gr)5018.7 Külçe alt
- Page 573 and 574:
(Milyon YTL /Million TRY)120 00018.
- Page 575 and 576:
18.1 Para Stoku (M1,M2) (devam)Mone
- Page 577 and 578:
18.2 Vade ve türlerine göre mevdu
- Page 579 and 580:
18.4 Döviz kurlarıExchange ratesA
- Page 581 and 582:
18.4 Döviz kurları (devam)Exchang
- Page 583 and 584:
18.5 Altın fiyatları (Yıllık or
- Page 585 and 586:
18.7 Faiz oranlarıInterest rates(%
- Page 587 and 588:
18.9 İMKB fiyat endekslerinin yıl
- Page 589 and 590:
SayfaPageAçıklama 583 Explanation
- Page 591 and 592:
19.1 Konsolide bütçe gelir ve har
- Page 593 and 594:
(Milyon $ - Millon $)300 00019.5 D
- Page 595 and 596:
19.1 Genel bütçe, bütçe ve kesi
- Page 597 and 598:
19.3 Katma bütçeli kuruluşların
- Page 599 and 600:
19.4 Hazine gelirlerinin türlerine
- Page 601 and 602:
19.5 Konsolide bütçe dengesi (Esk
- Page 603 and 604:
19.5 Konsolide bütçe dengesi (Esk
- Page 605 and 606:
19.5 Konsolide bütçe dengesi (Esk
- Page 607 and 608:
19.5 Konsolide bütçe dengesi ve f
- Page 609 and 610:
19.6 Konsolide bütçe gelir ve har
- Page 611 and 612:
19.6 Konsolide bütçe gelir ve har
- Page 613 and 614:
19.7 İç borç stokuDomestic debt
- Page 615 and 616:
19.7 İç borç stoku (devam)Domest
- Page 617 and 618:
19.7 İç borç stoku (devam)Domest
- Page 619 and 620:
19.8 İç borç stokuna ait bazı g
- Page 621 and 622:
19.9 Dış borçlara ait bazı gös
- Page 623 and 624:
19.10 Dış Borç Stokunun Profili
- Page 625 and 626:
19.10 Dış Borç Stokunun Profili
- Page 627 and 628:
19.11 Dış borç stoku (devam)Outs
- Page 629 and 630:
19.11 Dış borç stoku (devam)Outs
- Page 631 and 632:
19.11 Dış borç stoku (devam)Outs
- Page 633 and 634:
19.11 Dış borç stoku (devam)Outs
- Page 635 and 636:
19.11 Dış borç stoku (devam)Outs
- Page 637 and 638:
19.12 Borçluya göre dış borç s
- Page 639 and 640:
19.12 Borçluya göre dış borç s
- Page 641 and 642:
19.13 Alacaklıya göre dış borç
- Page 643 and 644:
19.13 Alacaklıya göre dış borç
- Page 645 and 646:
20.19 GSYH sektörel büyüme hızl
- Page 647 and 648:
2(Bin YTL-Thousand TRY)20.1 Kişi b
- Page 649 and 650:
100(%)20.5 Sabit fiyatlarla GSYH se
- Page 651 and 652:
20.1 Ana iktisadi faaliyet kolları
- Page 653 and 654:
20.2 Ana iktisadi faaliyet kolları
- Page 655 and 656:
20.3 Kişi başına Gayri Safi Yurt
- Page 657 and 658:
20.6 Ana iktisadi faaliyet kolları
- Page 659 and 660:
20.8 İktisadi faaliyet kollarına
- Page 661 and 662:
20.8 İktisadi faaliyet kollarına
- Page 663 and 664:
20.8 İktisadi faaliyet kollarına
- Page 665 and 666:
20.8 İktisadi faaliyet kollarına
- Page 667 and 668:
20.8 İktisadi faaliyet kollarına
- Page 669 and 670:
20.8 İktisadi faaliyet kollarına
- Page 671 and 672:
20.9 İktisadi faaliyet kollarına
- Page 673 and 674:
20.10 İktisadi faaliyet kollarına
- Page 675 and 676:
20.10 İktisadi faaliyet kollarına
- Page 677 and 678:
20.11 İktisadi faaliyet kollarına
- Page 679 and 680:
20.11 İktisadi faaliyet kollarına
- Page 681 and 682:
20.12 İktisadi faaliyet kollarına
- Page 683 and 684:
20.12 İktisadi faaliyet kollarına
- Page 685 and 686:
20.13 İktisadi faaliyet kollarına
- Page 687 and 688:
20.14 Kişi başına Gayri Safi Mil
- Page 689 and 690:
20.16 Sektörlerin Gayri Safi Milli
- Page 691 and 692:
20.17 Sektörlerin Gayri Safi Yurti
- Page 693 and 694:
20.18 Sektörlerin Gayri Safi Yurti
- Page 695 and 696:
20.19 GSYH sektörel büyüme hızl
- Page 697 and 698:
20.20 GSYH sektörel büyüme hızl
- Page 699 and 700:
20.21 Harcamalar yöntemiyle Gayri
- Page 701 and 702:
20.22 Harcamalar yöntemiyle Gayri
- Page 703 and 704:
20.22 Harcamalar yöntemiyle Gayri
- Page 705 and 706:
20.23 Harcamalar yöntemiyle Gayri
- Page 707 and 708:
20.24 Harcamalar yöntemiyle Gayri
- Page 709 and 710:
20.24 Harcamalar yöntemiyle Gayri
- Page 711 and 712:
20.25 Harcamalar yöntemiyle Gayri
- Page 713 and 714:
20.26 Harcamalar yöntemiyle Gayri
- Page 715 and 716:
20.26 Harcamalar yöntemiyle Gayri
- Page 717 and 718:
20.28 Harcamalar yöntemiyle Gayri
- Page 719 and 720:
20.30 Harcamalar yöntemiyle Gayri
- Page 721 and 722:
20.32 Harcamalar yöntemiyle Gayri
- Page 723 and 724:
20.34 Yerleşik ve yerleşik olmaya
- Page 725 and 726:
20.36 Gelir yöntemiyle Gayri Safi
- Page 727:
İlgili bilgilere ulaşmak için…