

EIB Papers Volume 13. n°1/2008 - European Investment Bank
EIB Papers Volume 13. n°1/2008 - European Investment Bank
EIB Papers Volume 13. n°1/2008 - European Investment Bank

Create successful ePaper yourself
Turn your PDF publications into a flip-book with our unique Google optimized e-Paper software.
Recent cost-of-funds<br />
estimates account for<br />
intensive and extensive<br />
labour-supply responses<br />
to changing wages.<br />
102 <strong>Volume</strong>13 N°1 <strong>2008</strong> <strong>EIB</strong> PAPERS<br />
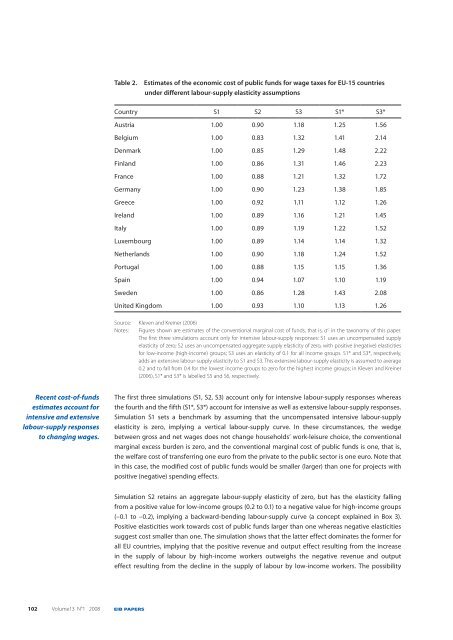
Table 2. Estimates of the economic cost of public funds for wage taxes for EU-15 countries<br />
under different labour-supply elasticity assumptions<br />
Country S1 S2 S3 S1* S3*<br />
Austria 1.00 0.90 1.18 1.25 1.56<br />
Belgium 1.00 0.83 1.32 1.41 2.14<br />
Denmark 1.00 0.85 1.29 1.48 2.22<br />
Finland 1.00 0.86 1.31 1.46 2.23<br />
France 1.00 0.88 1.21 1.32 1.72<br />
Germany 1.00 0.90 1.23 1.38 1.85<br />
Greece 1.00 0.92 1.11 1.12 1.26<br />
Ireland 1.00 0.89 1.16 1.21 1.45<br />
Italy 1.00 0.89 1.19 1.22 1.52<br />
Luxembourg 1.00 0.89 1.14 1.14 1.32<br />
Netherlands 1.00 0.90 1.18 1.24 1.52<br />
Portugal 1.00 0.88 1.15 1.15 1.36<br />
Spain 1.00 0.94 1.07 1.10 1.19<br />
Sweden 1.00 0.86 1.28 1.43 2.08<br />
United Kingdom 1.00 0.93 1.10 1.13 1.26<br />
Source: Kleven and Kreiner (2006)<br />
Notes: Figures shown are estimates of the conventional marginal cost of funds, that is, α C in the taxonomy of this paper.<br />
The first three simulations account only for intensive labour-supply responses: S1 uses an uncompensated supply<br />
elasticity of zero; S2 uses an uncompensated aggregate supply elasticity of zero, with positive (negative) elasticities<br />
for low-income (high-income) groups; S3 uses an elasticity of 0.1 for all income groups. S1* and S3*, respectively,<br />
adds an extensive labour-supply elasticity to S1 and S3. This extensive labour-supply elasticity is assumed to average<br />
0.2 and to fall from 0.4 for the lowest income groups to zero for the highest income groups; in Kleven and Kreiner<br />
(2006), S1* and S3* is labelled S5 and S6, respectively.<br />
The first three simulations (S1, S2, S3) account only for intensive labour-supply responses whereas<br />
the fourth and the fifth (S1*, S3*) account for intensive as well as extensive labour-supply responses.<br />
Simulation S1 sets a benchmark by assuming that the uncompensated intensive labour-supply<br />
elasticity is zero, implying a vertical labour-supply curve. In these circumstances, the wedge<br />
between gross and net wages does not change households’ work-leisure choice, the conventional<br />
marginal excess burden is zero, and the conventional marginal cost of public funds is one, that is,<br />
the welfare cost of transferring one euro from the private to the public sector is one euro. Note that<br />
in this case, the modified cost of public funds would be smaller (larger) than one for projects with<br />
positive (negative) spending effects.<br />
Simulation S2 retains an aggregate labour-supply elasticity of zero, but has the elasticity falling<br />
from a positive value for low-income groups (0.2 to 0.1) to a negative value for high-income groups<br />
(–0.1 to –0.2), implying a backward-bending labour-supply curve (a concept explained in Box 3).<br />
Positive elasticities work towards cost of public funds larger than one whereas negative elasticities<br />
suggest cost smaller than one. The simulation shows that the latter effect dominates the former for<br />
all EU countries, implying that the positive revenue and output effect resulting from the increase<br />
in the supply of labour by high-income workers outweighs the negative revenue and output<br />
effect resulting from the decline in the supply of labour by low-income workers. The possibility


