

EIB Papers Volume 13. n°1/2008 - European Investment Bank
EIB Papers Volume 13. n°1/2008 - European Investment Bank
EIB Papers Volume 13. n°1/2008 - European Investment Bank

Create successful ePaper yourself
Turn your PDF publications into a flip-book with our unique Google optimized e-Paper software.
40 <strong>Volume</strong>13 N°1 <strong>2008</strong> <strong>EIB</strong> PAPERS<br />
infrastructure. This production value serves as a proxy for gross capital formation in transport<br />
infrastructure assets.<br />
This estimate is, of course, subject to major caveats. First, we cannot know how well the<br />
reported production value of, e.g., road construction companies, proxies the formation of road<br />
assets. Second, the data cover the construction and, to some extent, maintenance of highways,<br />
roads, railways, airfields, waterways, ports as well as sports facilities but not, e.g., bridges and<br />
tunnels. So the difference between sports facilities (which we would wish to exclude) and<br />
bridges and tunnels (which we would wish to include) introduces an error to the estimate.<br />
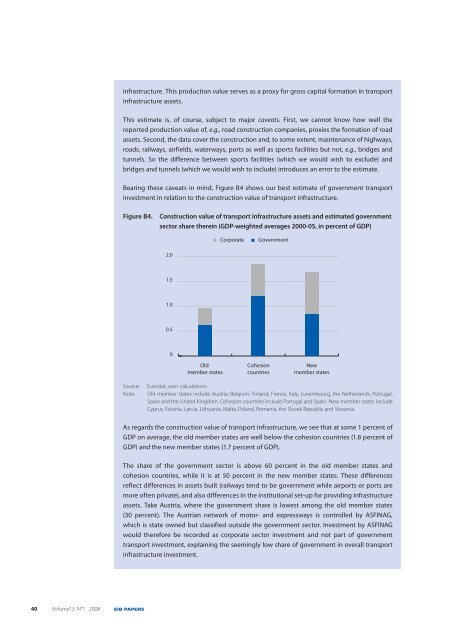
Bearing these caveats in mind, Figure B4 shows our best estimate of government transport<br />
investment in relation to the construction value of transport infrastructure.<br />
Figure B4. Construction value of transport infrastructure assets and estimated government<br />
sector share therein (GDP-weighted averages 2000-05, in percent of GDP)<br />
2.0<br />
1.5<br />
1.0<br />
0.5<br />
0<br />
Old<br />
member states<br />
Corporate Government<br />
Cohesion<br />
countries<br />
New<br />
member states<br />
Source: Eurostat, own calculations<br />
Note: Old member states include Austria, Belgium, Finland, France, Italy, Luxembourg, the Netherlands, Portugal,<br />
Spain and the United Kingdom. Cohesion countries include Portugal and Spain. New member states include<br />
Cyprus, Estonia, Latvia, Lithuania, Malta, Poland, Romania, the Slovak Republic and Slovenia.<br />
As regards the construction value of transport infrastructure, we see that at some 1 percent of<br />
GDP on average, 4,0 the old member states are well below the cohesion countries (1.8 percent of<br />
GDP) and the new 3,5 member states (1.7 percent of GDP).<br />
3,0<br />
The share of the government sector is above 60 percent in the old member states and<br />
cohesion countries, 2,5 while it is at 50 percent in the new member states. These differences<br />
reflect differences 2,0 in assets built (railways tend to be government while airports or ports are<br />
more often private), and also differences in the institutional set-up for providing infrastructure<br />
1,5<br />
assets. Take Austria, where the government share is lowest among the old member states<br />
1,0<br />
(30 percent). The Austrian network of motor- and expressways is controlled by ASFINAG,<br />
which is state 0,5 owned but classified outside the government sector. <strong>Investment</strong> by ASFINAG<br />
would therefore 0 be recorded as corporate sector investment and not part of government<br />
transport investment, explaining<br />
EU-15<br />
the seemingly<br />
Cohesion<br />
low share of government<br />
NMS<br />
in overall transport<br />
infrastructure investment.


