

EIB Papers Volume 13. n°1/2008 - European Investment Bank
EIB Papers Volume 13. n°1/2008 - European Investment Bank
EIB Papers Volume 13. n°1/2008 - European Investment Bank

Create successful ePaper yourself
Turn your PDF publications into a flip-book with our unique Google optimized e-Paper software.
Has the impact of<br />
public capital on output<br />
changed over time?<br />
Estimate of LR e�ect on GDP<br />
74 <strong>Volume</strong>13 N°1 <strong>2008</strong> <strong>EIB</strong> PAPERS<br />
3<br />
2<br />
1<br />
0<br />
-1<br />
-2<br />
-3<br />
FRA<br />
CAN<br />
ITA<br />
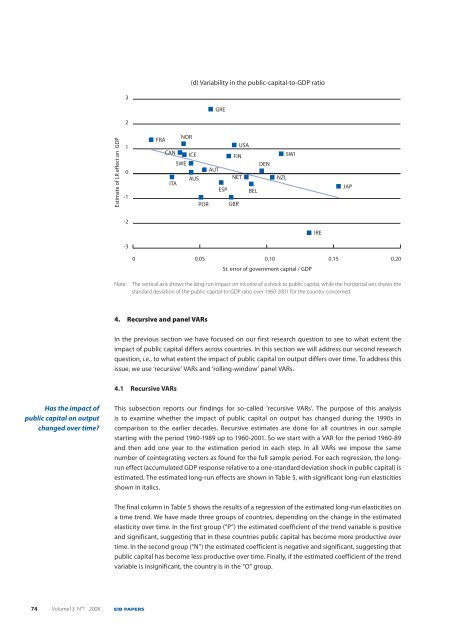
(d) Variability in the public-capital-to-GDP ratio<br />
0 0.05 0.10 0.15 0.20<br />
Note: The vertical axis shows the long-run impact on income of a shock to public capital, while the horizontal axis shows the<br />
standard deviation of the public-capital-to-GDP ratio over 1960-2001 for the country concerned.<br />
4. Recursive and panel VARs<br />
In the previous section we have focused on our first research question to see to what extent the<br />
impact of public capital differs across countries. In this section we will address our second research<br />
question, i.e., to what extent the impact of public capital on output differs over time. To address this<br />
issue, we use ‘recursive’ VARs and ‘rolling-window’ panel VARs.<br />
4.1 Recursive VARs<br />
SWE<br />
NOR<br />
ICE<br />
AUS<br />
POR<br />
AUT<br />
GRE<br />
ESP<br />
FIN<br />
USA<br />
St. error of government capital / GDP<br />
This subsection reports our findings for so-called ‘recursive VARs’. The purpose of this analysis<br />
is to examine whether the impact of public capital on output has changed during the 1990s in<br />
comparison to the earlier decades. Recursive estimates are done for all countries in our sample<br />
starting with the period 1960-1989 up to 1960-2001. So we start with a VAR for the period 1960-89<br />
and then add one year to the estimation period in each step. In all VARs we impose the same<br />
number of cointegrating vectors as found for the full sample period. For each regression, the longrun<br />
effect (accumulated GDP response relative to a one-standard deviation shock in public capital) is<br />
estimated. The estimated long-run effects are shown in Table 5, with significant long-run elasticities<br />
shown in italics.<br />
The final column in Table 5 shows the results of a regression of the estimated long-run elasticities on<br />
a time trend. We have made three groups of countries, depending on the change in the estimated<br />
elasticity over time. In the first group (“P”) the estimated coefficient of the trend variable is positive<br />
and significant, suggesting that in these countries public capital has become more productive over<br />
time. In the second group (“N”) the estimated coefficient is negative and significant, suggesting that<br />
public capital has become less productive over time. Finally, if the estimated coefficient of the trend<br />
variable is insignificant, the country is in the “O” group.<br />
DEN<br />
NET NZL<br />
GBR<br />
BEL<br />
SWI<br />
IRE<br />
JAP


