

EIB Papers Volume 13. n°1/2008 - European Investment Bank
EIB Papers Volume 13. n°1/2008 - European Investment Bank
EIB Papers Volume 13. n°1/2008 - European Investment Bank

You also want an ePaper? Increase the reach of your titles
YUMPU automatically turns print PDFs into web optimized ePapers that Google loves.
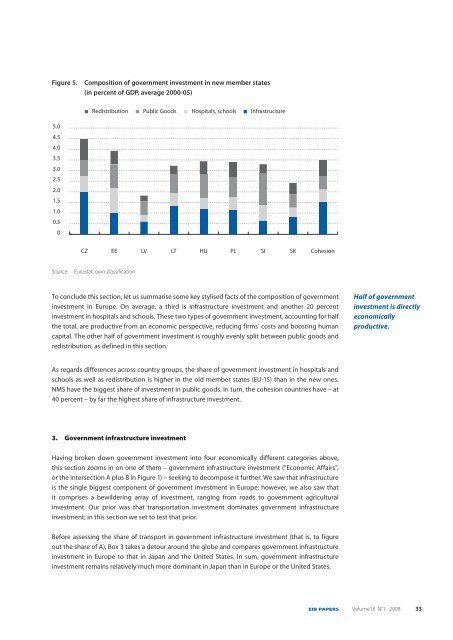
Figure 5. Composition of government investment in new member states<br />
(in percent of GDP, average 2000-05)<br />
5.0<br />
4.5<br />
4.0<br />
3.5<br />
3.0<br />
2.5<br />
2.0<br />
1.5<br />
1.0<br />
0.5<br />
0<br />
CZ<br />
Redistribution Public Goods Hospitals, schools Infrastructure<br />
EE<br />
Source: Eurostat, own classification<br />
LV<br />
LT<br />
HU<br />
PL<br />
SI<br />
SK<br />
Cohesion<br />
To conclude this section, let us summarise some key stylised facts of the composition of government<br />
investment in Europe. On average, a third is infrastructure investment and another 20 percent<br />
investment in hospitals and schools. These two types of government investment, accounting for half<br />
the total, are productive from an economic perspective, reducing firms’ costs and boosting human<br />
capital. The other half of government investment is roughly evenly split between public goods and<br />
redistribution, as defined in this section.<br />
As regards differences across country groups, the share of government investment in hospitals and<br />
schools as well as redistribution is higher in the old member states (EU-15) than in the new ones.<br />
NMS have the biggest share of investment in public goods. In turn, the cohesion countries have – at<br />
40 percent – by far the highest share of infrastructure investment.<br />
3. Government infrastructure investment<br />
Having broken down government investment into four economically different categories above,<br />
this section zooms in on one of them – government infrastructure investment (“Economic Affairs”,<br />
or the intersection A plus B in Figure 1) – seeking to decompose it further. We saw that infrastructure<br />
is the single biggest component of government investment in Europe; however, we also saw that<br />
it comprises a bewildering array of investment, ranging from roads to government agricultural<br />
investment. Our prior was that transportation investment dominates government infrastructure<br />
investment; in this section we set to test that prior.<br />
Before assessing the share of transport in government infrastructure investment (that is, to figure<br />
out the share of A), Box 3 takes a detour around the globe and compares government infrastructure<br />
investment in Europe to that in Japan and the United States. In sum, government infrastructure<br />
investment remains relatively much more dominant in Japan than in Europe or the United States.<br />
Half of government<br />
investment is directly<br />
economically<br />
productive.<br />
<strong>EIB</strong> PAPERS <strong>Volume</strong>13 N°1 <strong>2008</strong> 33


