

EIB Papers Volume 13. n°1/2008 - European Investment Bank
EIB Papers Volume 13. n°1/2008 - European Investment Bank
EIB Papers Volume 13. n°1/2008 - European Investment Bank

You also want an ePaper? Increase the reach of your titles
YUMPU automatically turns print PDFs into web optimized ePapers that Google loves.
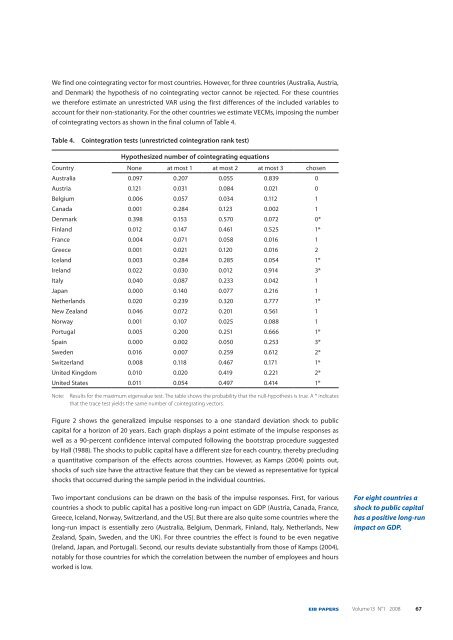
We find one cointegrating vector for most countries. However, for three countries (Australia, Austria,<br />
and Denmark) the hypothesis of no cointegrating vector cannot be rejected. For these countries<br />
we therefore estimate an unrestricted VAR using the first differences of the included variables to<br />
account for their non-stationarity. For the other countries we estimate VECMs, imposing the number<br />
of cointegrating vectors as shown in the final column of Table 4.<br />
Table 4. Cointegration tests (unrestricted cointegration rank test)<br />
Hypothesized number of cointegrating equations<br />
Country None at most 1 at most 2 at most 3 chosen<br />
Australia 0.097 0.207 0.055 0.839 0<br />
Austria 0.121 0.031 0.084 0.021 0<br />
Belgium 0.006 0.057 0.034 0.112 1<br />
Canada 0.001 0.284 0.123 0.002 1<br />
Denmark 0.398 0.153 0.570 0.072 0*<br />
Finland 0.012 0.147 0.461 0.525 1*<br />
France 0.004 0.071 0.058 0.016 1<br />
Greece 0.001 0.021 0.120 0.016 2<br />
Iceland 0.003 0.284 0.285 0.054 1*<br />
Ireland 0.022 0.030 0.012 0.914 3*<br />
Italy 0.040 0.087 0.233 0.042 1<br />
Japan 0.000 0.140 0.077 0.216 1<br />
Netherlands 0.020 0.239 0.320 0.777 1*<br />
New Zealand 0.046 0.072 0.201 0.561 1<br />
Norway 0.001 0.107 0.025 0.088 1<br />
Portugal 0.005 0.200 0.251 0.666 1*<br />
Spain 0.000 0.002 0.050 0.253 3*<br />
Sweden 0.016 0.007 0.259 0.612 2*<br />
Switzerland 0.008 0.118 0.467 0.171 1*<br />
United Kingdom 0.010 0.020 0.419 0.221 2*<br />
United States 0.011 0.054 0.497 0.414 1*<br />
Note: Results for the maximum eigenvalue test. The table shows the probability that the null-hypothesis is true. A * indicates<br />
that the trace test yields the same number of cointegrating vectors.<br />
Figure 2 shows the generalized impulse responses to a one standard deviation shock to public<br />
capital for a horizon of 20 years. Each graph displays a point estimate of the impulse responses as<br />
well as a 90-percent confidence interval computed following the bootstrap procedure suggested<br />
by Hall (1988). The shocks to public capital have a different size for each country, thereby precluding<br />
a quantitative comparison of the effects across countries. However, as Kamps (2004) points out,<br />
shocks of such size have the attractive feature that they can be viewed as representative for typical<br />
shocks that occurred during the sample period in the individual countries.<br />
Two important conclusions can be drawn on the basis of the impulse responses. First, for various<br />
countries a shock to public capital has a positive long-run impact on GDP (Austria, Canada, France,<br />
Greece, Iceland, Norway, Switzerland, and the US). But there are also quite some countries where the<br />
long-run impact is essentially zero (Australia, Belgium, Denmark, Finland, Italy, Netherlands, New<br />
Zealand, Spain, Sweden, and the UK). For three countries the effect is found to be even negative<br />
(Ireland, Japan, and Portugal). Second, our results deviate substantially from those of Kamps (2004),<br />
notably for those countries for which the correlation between the number of employees and hours<br />
worked is low.<br />
For eight countries a<br />
shock to public capital<br />
has a positive long-run<br />
impact on GDP.<br />
<strong>EIB</strong> PAPERS <strong>Volume</strong>13 N°1 <strong>2008</strong> 67


