

EIB Papers Volume 13. n°1/2008 - European Investment Bank
EIB Papers Volume 13. n°1/2008 - European Investment Bank
EIB Papers Volume 13. n°1/2008 - European Investment Bank

Create successful ePaper yourself
Turn your PDF publications into a flip-book with our unique Google optimized e-Paper software.
Government transport<br />
investment has not<br />
consistently followed<br />
the ups and downs of<br />
fiscal balances.<br />
48 <strong>Volume</strong>13 N°1 <strong>2008</strong> <strong>EIB</strong> PAPERS<br />
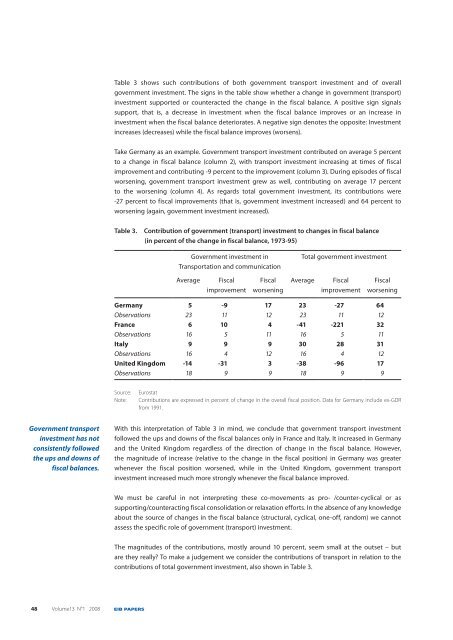
Table 3 shows such contributions of both government transport investment and of overall<br />
government investment. The signs in the table show whether a change in government (transport)<br />
investment supported or counteracted the change in the fiscal balance. A positive sign signals<br />
support, that is, a decrease in investment when the fiscal balance improves or an increase in<br />
investment when the fiscal balance deteriorates. A negative sign denotes the opposite: <strong>Investment</strong><br />
increases (decreases) while the fiscal balance improves (worsens).<br />
Take Germany as an example. Government transport investment contributed on average 5 percent<br />
to a change in fiscal balance (column 2), with transport investment increasing at times of fiscal<br />
improvement and contributing -9 percent to the improvement (column 3). During episodes of fiscal<br />
worsening, government transport investment grew as well, contributing on average 17 percent<br />
to the worsening (column 4). As regards total government investment, its contributions were<br />
-27 percent to fiscal improvements (that is, government investment increased) and 64 percent to<br />
worsening (again, government investment increased).<br />
Table 3. Contribution of government (transport) investment to changes in fiscal balance<br />
(in percent of the change in fiscal balance, 1973-95)<br />
Government investment in<br />
Transportation and communication<br />
Average Fiscal<br />
improvement<br />
Fiscal<br />
worsening<br />
Total government investment<br />
Average Fiscal<br />
improvement<br />
Fiscal<br />
worsening<br />
Germany 5 -9 17 23 -27 64<br />
Observations 23 11 12 23 11 12<br />
France 6 10 4 -41 -221 32<br />
Observations 16 5 11 16 5 11<br />
Italy 9 9 9 30 28 31<br />
Observations 16 4 12 16 4 12<br />
United Kingdom -14 -31 3 -38 -96 17<br />
Observations 18 9 9 18 9 9<br />
Source: Eurostat<br />
Note: Contributions are expressed in percent of change in the overall fiscal position. Data for Germany include ex-GDR<br />
from 1991.<br />
With this interpretation of Table 3 in mind, we conclude that government transport investment<br />
followed the ups and downs of the fiscal balances only in France and Italy. It increased in Germany<br />
and the United Kingdom regardless of the direction of change in the fiscal balance. However,<br />
the magnitude of increase (relative to the change in the fiscal position) in Germany was greater<br />
whenever the fiscal position worsened, while in the United Kingdom, government transport<br />
investment increased much more strongly whenever the fiscal balance improved.<br />
We must be careful in not interpreting these co-movements as pro- /counter-cyclical or as<br />
supporting/counteracting fiscal consolidation or relaxation efforts. In the absence of any knowledge<br />
about the source of changes in the fiscal balance (structural, cyclical, one-off, random) we cannot<br />
assess the specific role of government (transport) investment.<br />
The magnitudes of the contributions, mostly around 10 percent, seem small at the outset – but<br />
are they really? To make a judgement we consider the contributions of transport in relation to the<br />
contributions of total government investment, also shown in Table 3.


