Templates and Guidelines for PowerPoint - Rieter
Templates and Guidelines for PowerPoint - Rieter
Templates and Guidelines for PowerPoint - Rieter
Create successful ePaper yourself
Turn your PDF publications into a flip-book with our unique Google optimized e-Paper software.
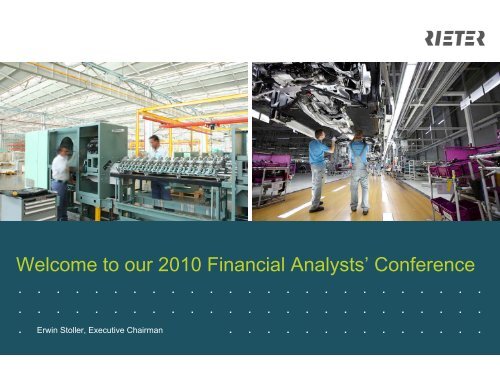
Welcome to our 2010 Financial Analysts’ Conference<br />
. . . . . . . . . . . . . . . . . . . . . . . . .<br />
. . . . . . . . . . . . . . . . . . . . . . . . .<br />
. Erwin . . Stoller, . Executive . . Chairman<br />
. . . . . . . . . . . . . . . . . . .
Agenda<br />
• Introduction Erwin Stoller, Executive Chairman<br />
• Review of business year 2009 Urs Leinhäuser, Chief Financial Officer<br />
• Outlook Erwin Stoller, Executive Chairman<br />
Financial Analysts’ Conference March 23, 2010 <strong>Rieter</strong>-Konzern<br />
2
Massive sales decline led to operating losses<br />
• Difficult market conditions <strong>for</strong> both divisions<br />
• Sales 38% lower than prior year <strong>and</strong> 50% lower than 2007<br />
• Operating losses despite drastic adjustments<br />
Financial Analysts’ Conference March 23, 2010 <strong>Rieter</strong>-Konzern<br />
3
Textile industry: market slump in spinning machinery<br />
Spindle Equiv. Shipments (in million)<br />
20<br />
18<br />
16<br />
14<br />
12<br />
10<br />
8<br />
6<br />
4<br />
2<br />
0<br />
1990<br />
1992<br />
All others<br />
SE Asia<br />
India<br />
China<br />
1994<br />
1996<br />
1998<br />
2000<br />
2002<br />
China Boom<br />
Shipments: 1 Rotor = 6 Ringspindle equivalents;; 1 Airjet = 20 Ringspindle equiv.<br />
Source: Gherzi / DT Marketing<br />
Financial Analysts’ Conference March 23, 2010 <strong>Rieter</strong>-Konzern<br />
2004<br />
India Boom<br />
2006<br />
< Actuals Forecast ><br />
2008<br />
2010<br />
2012<br />
2014<br />
4
Automotive industry: global car production (light<br />
vehicles)<br />
100<br />
90<br />
80<br />
70<br />
60<br />
50<br />
40<br />
30<br />
20<br />
10<br />
in million. < Actuals Forecast ><br />
0<br />
1996 1998 2000 2002 2004 2006 2008 2010 2012 2014<br />
Western Europe<br />
South America<br />
North America<br />
Eastern Europe<br />
Japan<br />
India<br />
China<br />
Rest of Asia<br />
Rest of the world<br />
Source: Global Insight, March 8, 2010<br />
Financial Analysts’ Conference March 23, 2010 <strong>Rieter</strong>-Konzern<br />
5
What have we achieved in 2009?<br />
• Measures implemented to financially stabilize the group<br />
• Breakeven point lowered <strong>and</strong> capacities reduced<br />
• Product innovation spurred<br />
Financial Analysts’ Conference March 23, 2010 <strong>Rieter</strong>-Konzern<br />
6
Severe test passed successfully in 2009<br />
• Corporate financing safeguarded, losses halved in HY2<br />
• In spite of massive redundancies no key people lost<br />
• In both divisions <strong>Rieter</strong> has fully benefited from market recovery since mid 2009<br />
“Severe test successfully faced thanks to the strenuous<br />
ef<strong>for</strong>ts <strong>and</strong> commitment of all <strong>Rieter</strong> people <strong>and</strong> the<br />
confidence of <strong>Rieter</strong> shareholders”<br />
Financial Analysts’ Conference March 23, 2010 <strong>Rieter</strong>-Konzern<br />
7
Review of the business year 2009<br />
. . . . . . . . . . . . . . . . . . . . . . . . .<br />
. . . . . . . . . . . . . . . . . . . . . . . . .<br />
. Urs . Leinhäuser, . . . Chief . Financial . . Officer<br />
. . . . . . . . . . . . . . . . .
Financial key figures 2009<br />
• Sales 2007-2009 -50%<br />
• Operating result -187 million CHF (prior year -312 million CHF)<br />
• Net result -218 million CHF (prior year -397 million CHF)<br />
• Equity ratio 36.1% (prior year 35.7%)<br />
• Net liquidity +10 million CHF (prior year -37 million CHF)<br />
• Restructuring 2008 - 2009 -2361 employees (FTE)<br />
• Change HY2 09 vs. HY1 09<br />
• Orders received +30%<br />
• Sales +17%<br />
• Operating result (EBIT) +87 million CHF<br />
Financial Analysts’ Conference March 23, 2010 <strong>Rieter</strong>-Konzern<br />
9
Orders received per half-year<br />
million CHF<br />
2'000<br />
1'500<br />
1'000<br />
500<br />
0<br />
2008: 2‘561<br />
1'559<br />
1'002<br />
-24%<br />
2009: 1‘935<br />
840<br />
1'095<br />
HY1 08 HY2 08 HY1 09 HY2 09<br />
• Overall sales decline 626<br />
million CHF or 24% in 2009<br />
• Orders received in HY2 09 9%<br />
higher than in HY2 08 <strong>and</strong><br />
30% higher than in HY1 09<br />
• Significantly more orders<br />
received in both divisions<br />
• Orders received vs. sales<br />
(book-to-bill ratio) >1 as of<br />
HY2 2009<br />
Financial Analysts’ Conference March 23, 2010 <strong>Rieter</strong>-Konzern<br />
10
Orders received per half-year by division<br />
million CHF<br />
2009: 511<br />
2009: 1‘424<br />
• Positive trend with<br />
Textile Systems since<br />
Q2 09, <strong>and</strong> with<br />
1'200<br />
1'142<br />
Automotive Systems<br />
since Q3 09<br />
1'000<br />
800<br />
600<br />
400<br />
200<br />
0<br />
417<br />
122<br />
190<br />
321<br />
Financial Analysts’ Conference March 23, 2010 <strong>Rieter</strong>-Konzern<br />
880<br />
650<br />
774<br />
HY1 08 HY2 08 HY1 09 HY2 09 HY1 08 HY2 08 HY1 09 HY2 09<br />
Textile Systems Automotive Systems<br />
• Textile Systems orders<br />
69% higher in HY2 than<br />
in HY1 09<br />
• Also <strong>for</strong> Automotive<br />
Systems, better market<br />
conditions in HY2;<br />
<strong>for</strong> Automotive Orders<br />
received = sales<br />
11
Sales per half-year<br />
million CHF<br />
2'000<br />
1'500<br />
1'000<br />
500<br />
0<br />
2008: 3‘143<br />
1'807<br />
1'336<br />
-38%<br />
2009: 1‘956<br />
900<br />
1'056<br />
HY1 08 HY2 08 HY1 09 HY2 09<br />
• Marked sales decline in 2009<br />
of 1187 million CHF or 38%<br />
• Downturn bottomed out in<br />
HY1 2009<br />
• Sales in HY2 09 17% higher<br />
than in HY1 09<br />
Financial Analysts’ Conference March 23, 2010 <strong>Rieter</strong>-Konzern<br />
12
Sales per half-year by division<br />
million CHF<br />
1'200<br />
1'000<br />
800<br />
600<br />
400<br />
200<br />
0<br />
665<br />
455<br />
2009: 532 2009: 1‘424<br />
• Textile Systems sales 27%<br />
1'142<br />
(prior year 36%) of Group<br />
sales, Automotive Systems<br />
73% (prior year 64%);<br />
Textile Systems more<br />
880<br />
seriously affected by<br />
774 recession<br />
250<br />
282<br />
Financial Analysts’ Conference March 23, 2010 <strong>Rieter</strong>-Konzern<br />
650<br />
HY1 08 HY2 08 HY1 09 HY2 09 HY1 08 HY2 08 HY1 09 HY2 09<br />
Textile Systems<br />
Automotive Systems<br />
• In both divisions downturn<br />
bottomed out in HY1<br />
• Textile Systems sales in<br />
HY2 13% higher than in<br />
HY1<br />
• Automotive Systems sales<br />
in HY2 19% higher than in<br />
HY1<br />
13
Sales development by region<br />
million CHF<br />
2'000<br />
1'600<br />
1'200<br />
800<br />
400<br />
0<br />
1'505<br />
-38%<br />
936<br />
Europe +<br />
Africa<br />
791<br />
-49%<br />
405<br />
589<br />
-26%<br />
433<br />
Asia North<br />
America<br />
257<br />
-29%<br />
Financial Analysts’ Conference March 23, 2010 <strong>Rieter</strong>-Konzern<br />
182<br />
Latin<br />
America<br />
2008<br />
2009<br />
• Strong global presence<br />
maintained<br />
• All regions affected by the<br />
global recession<br />
• Steepest decline in Asia<br />
due to weak dem<strong>and</strong> <strong>for</strong><br />
textile machinery<br />
14
Operating result be<strong>for</strong>e special charges, per half-year<br />
million CHF<br />
150<br />
100<br />
50<br />
0<br />
-50<br />
-100<br />
-150<br />
-200<br />
2008: 22 -209<br />
2009: -187<br />
89<br />
-67<br />
-137<br />
• 2009: first negative Group<br />
operating result (be<strong>for</strong>e<br />
special charges) since a very<br />
long time<br />
• Above all HY1 was still<br />
seriously affected by adverse<br />
market conditions<br />
• Operating loss in HY2 less<br />
than half of HY1 loss thanks<br />
to improvements in both<br />
divisions<br />
• Restructuring <strong>and</strong> cost<br />
reductions brought first<br />
results in HY2<br />
• Breakeven point further<br />
lowered<br />
• Operating result in HY2<br />
also affected positively by<br />
volumes<br />
Financial Analysts’ Conference March 23, 2010 <strong>Rieter</strong>-Konzern<br />
-50<br />
HY1 HY2 HY1 HY2<br />
15
Operating result (EBIT) by division per half-year<br />
million CHF<br />
100<br />
50<br />
0<br />
-50<br />
-100<br />
-150<br />
-200<br />
-250<br />
-300<br />
-350<br />
-400<br />
19<br />
55<br />
-105<br />
-270<br />
-58<br />
-78<br />
-15<br />
-27<br />
HY1 HY2 HY1 HY2<br />
Textile Systems Automotive Systems<br />
¹ ) Group<br />
2008: -312 ¹ ) 2009: -187 ¹ )<br />
+125<br />
• EBIT better than in prior year<br />
due to absence of special<br />
charges<br />
• Special charges in 2008:<br />
mainly <strong>for</strong> restructuring <strong>and</strong><br />
goodwill impairment<br />
• Textile: 91 million CHF<br />
• Automotive: 244 million CHF<br />
• Special charges in 2009:<br />
none<br />
• EBIT in HY2 still negative, but<br />
significantly improved<br />
Financial Analysts’ Conference March 23, 2010 <strong>Rieter</strong>-Konzern<br />
16
Restructuring: Progress of program<br />
In Implementation<br />
69<br />
38<br />
Finished 31<br />
Number of<br />
restructuring<br />
projects<br />
• Adjustment of plant structures in North America <strong>and</strong><br />
Western Europe – Five plant closures <strong>and</strong> downsizing<br />
of several plants achieved, further ones in<br />
implementation<br />
• Simplification of the organization <strong>and</strong> reduction of<br />
overhead costs – Re-organization at group level<br />
<strong>and</strong> in both divisions implemented, further progress<br />
in cost reduction<br />
• Leaner legal structure – Number of legal units<br />
reduced by 10%<br />
• Majority of projects will be finished in 2010 <strong>and</strong><br />
bring full savings impact in 2011<br />
Financial Analysts’ Conference March 23, 2010 <strong>Rieter</strong>-Konzern<br />
17
Restructuring: utilization of provisions<br />
million CHF 2009 2008<br />
Provisions per<br />
December 31 of prior<br />
year<br />
Reclassification<br />
Utilization<br />
Additions, net<br />
183.6<br />
-9.8<br />
-41.4<br />
Currency effects 0.1 -3.4<br />
Provisions per<br />
December 31<br />
-<br />
132.5 183.6<br />
• Restructuring provisions <strong>for</strong><br />
personnel reductions, plant<br />
closures <strong>and</strong> downsizing<br />
• Utilization according to plan<br />
• Provisions utilized were<br />
practically compensated by<br />
the resultant cost reductions<br />
• The remaining provisions of<br />
133 million CHF are adequate<br />
<strong>for</strong> the restructuring needs<br />
still outst<strong>and</strong>ing<br />
• All remaining restructuring<br />
projects are in course of<br />
implementation<br />
Financial Analysts’ Conference March 23, 2010 <strong>Rieter</strong>-Konzern<br />
4.4<br />
-<br />
-33.2<br />
215.8<br />
18
Restructuring: personnel reductions<br />
Full time equivalent (FTE) reductions including temporary staff<br />
4'500<br />
4'000<br />
3'500<br />
3'000<br />
2'500<br />
2'000<br />
1'500<br />
1'000<br />
500<br />
0<br />
2'250<br />
Announced<br />
in August<br />
2008<br />
1'500<br />
Announced<br />
in August<br />
2009<br />
3'750<br />
Restruct.<br />
plan<br />
1'130<br />
Implem.<br />
in 2008<br />
1'230<br />
Implem.<br />
in 2009<br />
2360<br />
=63%<br />
1'390<br />
Ongoing<br />
2010-2011<br />
• In two stages a total of 3750<br />
job reductions was<br />
announced<br />
• 63% of these took place in<br />
2009<br />
• The remaining reductions will<br />
take place mainly in 2010,<br />
continuing into 2011.<br />
• The restructuring plan will be<br />
implemented as announced<br />
• This restructuring plan helps<br />
to improve our footprint <strong>and</strong><br />
to lower the breakeven point<br />
Financial Analysts’ Conference March 23, 2010 <strong>Rieter</strong>-Konzern<br />
19
Net result<br />
million CHF 2009 2008<br />
Operating result be<strong>for</strong>e<br />
special charges -186.6 22.4<br />
Special charges 0 -334.5<br />
Operating result be<strong>for</strong>e<br />
interest <strong>and</strong> taxes<br />
(EBIT)<br />
Financial result<br />
Net result<br />
be<strong>for</strong>e taxes<br />
Taxes<br />
Net result<br />
-186.6<br />
-24.9<br />
-211.5<br />
-6.0<br />
-217.5<br />
-312.1<br />
-64.7<br />
-376.8<br />
-19.9<br />
-396.7<br />
• Net result 2009 very negative,<br />
but 179 million CHF better<br />
than prior year<br />
• Improvement attributable to<br />
the absence of special<br />
charges, a better financial<br />
result <strong>and</strong> lower taxes<br />
• Better financial result due to<br />
no more losses on sale of<br />
securities<br />
Financial Analysts’ Conference March 23, 2010 <strong>Rieter</strong>-Konzern<br />
20
Net result per half-year<br />
million CHF<br />
50<br />
0<br />
-50<br />
-100<br />
-150<br />
-200<br />
-250<br />
-300<br />
-350<br />
-400<br />
-450<br />
-500<br />
41<br />
2008: -397<br />
-438<br />
+179<br />
-146<br />
2009: -218<br />
-72<br />
HY1 HY2 HY1 HY2<br />
• After 2008, net result <strong>for</strong> 2009<br />
again very negative<br />
• Net result 179 million CHF better<br />
than in prior year, mainly due to<br />
better financial result <strong>and</strong><br />
absence of special charges<br />
• Net losses in HY1 halved in HY2,<br />
mainly due to lower operating<br />
losses<br />
Financial Analysts’ Conference March 23, 2010 <strong>Rieter</strong>-Konzern<br />
21
Capital expenditures <strong>and</strong> depreciation by division per<br />
half-year<br />
million CHF<br />
160<br />
140<br />
120<br />
100<br />
80<br />
60<br />
40<br />
20<br />
0<br />
141<br />
85<br />
53<br />
100<br />
53<br />
Capex 08 Deprec.<br />
2008<br />
-13 -79<br />
154<br />
62<br />
56<br />
6<br />
141<br />
94<br />
46<br />
Capex 09 Deprec.<br />
2009<br />
Textile Systems Automotive Systems<br />
• 79 million CHF (56 %) less<br />
capex than in 2008<br />
• Capex in by both divisions<br />
were scrutinized <strong>and</strong><br />
prioritized <strong>for</strong> only the most<br />
important projects<br />
• Strong position of the<br />
divisions not affected by<br />
reductions<br />
• Excess depreciation totaled<br />
79 million CHF in 2009, i.e.<br />
only 44% of depreciations<br />
reinvested<br />
• Capex volumes cannot be<br />
held at this low level<br />
Financial Analysts’ Conference March 23, 2010 <strong>Rieter</strong>-Konzern<br />
22
Net working capital<br />
million CHF 31.12.09 31.12.08<br />
Inventories<br />
Trade receivables<br />
Other receivables<br />
Trade payables<br />
Advance payments by<br />
customers<br />
Other current liabilities<br />
Net working capital<br />
266.0 361.3<br />
331.5<br />
99.4<br />
-226.8<br />
-63.3<br />
-387.3<br />
19.5<br />
382.1<br />
125.9<br />
-268.5<br />
-74.3<br />
-382.7<br />
143.8<br />
• Massive reduction of net<br />
working capital by 124<br />
million CHF<br />
• Reduction of inventories by<br />
95 million CHF despite<br />
security stocks <strong>for</strong> plant<br />
closures<br />
• Customer pressure on<br />
payment conditions almost<br />
completely passed on to<br />
suppliers<br />
• Advance payments by<br />
customers still successful<br />
with Textile Systems<br />
Financial Analysts’ Conference March 23, 2010 <strong>Rieter</strong>-Konzern<br />
23
Balance sheet<br />
million CHF 2009 2008<br />
Total assets 1‘814.1 2‘088.9<br />
Non-current assets<br />
(Goodwill<br />
Net working capital<br />
Cash <strong>and</strong> cash<br />
equivalents<br />
886.5<br />
0.0<br />
19.5<br />
217.7<br />
Marketable securities 13.0 7.7<br />
Financial debt<br />
Shareholders’ equity<br />
222.4<br />
655.8<br />
929.3<br />
In % of total assets 36.1 35.7<br />
Financial Analysts’ Conference March 23, 2010 <strong>Rieter</strong>-Konzern<br />
0.0)<br />
143.8<br />
282.6<br />
327.1<br />
746.2<br />
• Financial basis still sound<br />
• Equity ratio slightly improved<br />
thanks to assets reduction<br />
• Shareholder option plan <strong>and</strong><br />
sale of treasury shares to<br />
PCS Holding strengthened<br />
balance sheet by 103 million<br />
CHF<br />
• Goodwill already written off<br />
in 2008; no new goodwill in<br />
2009<br />
• Drastic reduction of net<br />
working capital<br />
• High amount of cash <strong>and</strong><br />
cash equivalents again per<br />
year-end<br />
• Lower financial debt, but<br />
committed credit lines<br />
24
Equity<br />
million CHF<br />
900<br />
800<br />
700<br />
600<br />
500<br />
400<br />
300<br />
200<br />
100<br />
0<br />
Equity Group<br />
result<br />
746<br />
-218<br />
Participation<br />
PCS<br />
56<br />
Shareholder<br />
option plan<br />
Currency<br />
effects<br />
Other Equity<br />
31.12.2008 31.12.2009<br />
Financial Analysts’ Conference March 23, 2010 <strong>Rieter</strong>-Konzern<br />
47<br />
6<br />
19<br />
656<br />
25
Free cash flow<br />
million CHF 2009 2008<br />
Net result -217.5<br />
Cash flow -93.0 -102.4<br />
Net cash flow -143.3 -69.9<br />
+/- Change in net working capital 141.7 127.1<br />
+/- Capital expenditure, net -45.4 -118.7<br />
+/- Investments in financial assets,<br />
net<br />
Financial Analysts’ Conference March 23, 2010 <strong>Rieter</strong>-Konzern<br />
-4.3<br />
-396.7<br />
-9.2<br />
+/- Change in securities -5.6 58.9<br />
+/- Divestments 22.1 41.7<br />
+/- Acquisitions 0.0 -8.5<br />
Free cash flow -34.8 21.4<br />
• Further reduction of net<br />
working capital<br />
• Heavy reduction of capital<br />
expenditure<br />
• Divestment of a subsidiary<br />
(22 million CHF)<br />
26
Development of net liquidity in 2009<br />
million CHF<br />
40<br />
30<br />
20<br />
10<br />
0<br />
-10<br />
-20<br />
-30<br />
-40<br />
-50<br />
-60<br />
-70<br />
-80<br />
-90<br />
-37<br />
Net liquidity<br />
-35<br />
Free<br />
cash flow<br />
+56<br />
Sale of<br />
treasury<br />
shares<br />
Currency<br />
effects<br />
31.12.2008 31.12.2009<br />
Financial Analysts’ Conference March 23, 2010 <strong>Rieter</strong>-Konzern<br />
+47<br />
Shareholder<br />
option plan<br />
-21<br />
+10<br />
Net liquidity<br />
27
Textile Systems 2009<br />
Leading global systems supplier <strong>for</strong> the entire spinning process<br />
Financial Analysts’ Conference March 23, 2010 <strong>Rieter</strong>-Konzern<br />
28
Textile Systems: Order intake<br />
Mio. CHF<br />
1'200<br />
1'000<br />
800<br />
600<br />
400<br />
200<br />
0<br />
2007: 1‘703 2008: 539 2009: 511<br />
1'084<br />
619<br />
417<br />
122<br />
190<br />
321<br />
HY1 HY2 HY1 HY2 HY1 HY2<br />
• Steep market downturn from<br />
March 2008 until mid-2009<br />
• Bottomed out in Q1 2009<br />
• Already in Q2 2009<br />
significantly higher dem<strong>and</strong><br />
<strong>for</strong> components<br />
• Dem<strong>and</strong> in HY2 69% higher<br />
than in HY1 2009<br />
• Biggest dem<strong>and</strong> in India,<br />
China <strong>and</strong> Turkey<br />
• Orders received vs. sales<br />
(book-to-bill ratio) >1 as of<br />
HY2<br />
Financial Analysts’ Conference March 23, 2010 <strong>Rieter</strong>-Konzern<br />
29
Textile Systems: Sales<br />
Mio. CHF<br />
1'000<br />
800<br />
600<br />
400<br />
200<br />
0<br />
2007: 1‘567 2008: 1‘120 2009: 532<br />
706<br />
861<br />
665<br />
455<br />
-53%<br />
250<br />
282<br />
HY1 HY2 HY1 HY2 HY1 HY2<br />
• Marked sales decline by<br />
53% or 588 million CHF due<br />
to lower order intake in prior<br />
period<br />
• Sales in HY2 13% higher<br />
than in HY1 due to more<br />
orders received as of<br />
summer 2009<br />
• Highest sales in China,<br />
India, Brazil <strong>and</strong> Turkey<br />
• Spare parts business less<br />
affected by downturn than<br />
machinery business<br />
Financial Analysts’ Conference March 23, 2010 <strong>Rieter</strong>-Konzern<br />
30
Textile Systems: Operating result be<strong>for</strong>e special<br />
charges, interest <strong>and</strong> tax<br />
Mio. CHF<br />
100<br />
50<br />
0<br />
-50<br />
-100<br />
2008: 41 2009: -73<br />
55<br />
-14<br />
-58<br />
-15<br />
HY1 HY2 HY1 HY2<br />
• 2009; first negative operating<br />
result be<strong>for</strong>e special charges<br />
since a very long time<br />
• Result affected by massive<br />
collapse of volumes <strong>and</strong> low<br />
workloads<br />
• Loss in HY2 09 greatly<br />
reduced from –58 to –15<br />
million CHF, thanks to<br />
restructuring, cost reductions<br />
<strong>and</strong> slightly higher volumes<br />
in HY2<br />
• Breakeven point significantly<br />
lowered<br />
• Same loss in HY2 09 as in<br />
HY2 08 despite 173 million<br />
CHF less sales in HY2,<br />
thanks to lower breakeven<br />
point<br />
Financial Analysts’ Conference March 23, 2010 <strong>Rieter</strong>-Konzern<br />
31
Automotive Systems 2009<br />
Leading automotive supplier <strong>for</strong> acoustics <strong>and</strong> thermal management<br />
Financial Analysts’ Conference March 23, 2010 <strong>Rieter</strong>-Konzern<br />
32
Automotive Systems: Sales<br />
million CHF<br />
1'400<br />
1'200<br />
1'000<br />
800<br />
600<br />
400<br />
200<br />
0<br />
2007: 2‘363 2008: 2‘022<br />
1214<br />
1149<br />
1142<br />
880<br />
-30%<br />
2009: 1‘424<br />
650<br />
774<br />
HY1 HY2 HY1 HY2 HY1 HY2<br />
• Steep decline of vehicle<br />
production in <strong>Rieter</strong>’s main<br />
markets<br />
• Automotive sales declined<br />
by about 600 million CHF or<br />
30% from prior year (–26%<br />
in local currencies)<br />
• In HY2 <strong>Rieter</strong> Automotive<br />
benefited from rather<br />
friendlier market conditions<br />
• Divisional sales 19% higher<br />
in HY2 than in HY1<br />
Financial Analysts’ Conference March 23, 2010 <strong>Rieter</strong>-Konzern<br />
33
Automotive Systems: Sales by customer groups<br />
Toyota<br />
8%<br />
Chrysler<br />
2%<br />
Mercedes<br />
4%<br />
Honda<br />
7%<br />
Fiat<br />
7%<br />
Trucks<br />
6%<br />
BMW<br />
11%<br />
Other<br />
5%<br />
Nissan<br />
5%<br />
TATA<br />
2%<br />
GM<br />
6%<br />
Renault<br />
7%<br />
• Broadly based customer<br />
portfolio<br />
• <strong>Rieter</strong> supplies all leading<br />
automobile manufacturers<br />
worldwide<br />
• Lower sales to Chrysler <strong>and</strong><br />
GM compensated by<br />
additional orders from Ford<br />
Financial Analysts’ Conference March 23, 2010 <strong>Rieter</strong>-Konzern<br />
PSA<br />
10%<br />
Volvo<br />
5%<br />
VW<br />
4%<br />
Ford<br />
11%<br />
34
Automotive Systems: Operating result be<strong>for</strong>e special<br />
charges, interest <strong>and</strong> tax<br />
million CHF<br />
100<br />
50<br />
0<br />
-50<br />
-100<br />
2008: -7<br />
39<br />
-46<br />
2009: -105<br />
-78<br />
-27<br />
HY1 HY2 HY1 HY2<br />
• Result affected by massive<br />
decline in volume, mainly in<br />
HY1<br />
• Restructuring <strong>and</strong><br />
outsourcing to low-cost<br />
countries start to improve<br />
results<br />
• In HY2 the operating result<br />
be<strong>for</strong>e special charges<br />
improved to -27 million CHF,<br />
compared to -78 million CHF<br />
in HY1<br />
• 19 million CHF less loss in<br />
HY2 09 than in HY2 08,<br />
despite sales decline by<br />
more than 100 million CHF,<br />
thanks to lower breakeven<br />
point<br />
Financial Analysts’ Conference March 23, 2010 <strong>Rieter</strong>-Konzern<br />
35
Outlook<br />
. . . . . . . . . . . . . . . . . . . . . . . . .<br />
. . . . . . . . . . . . . . . . . . . . . . . . .<br />
. Erwin . . Stoller, . Executive . . Chairman<br />
. . . . . . . . . . . . . . . . . . .
<strong>Rieter</strong> Group: Further development<br />
• Expansion in the Asian growth markets (China <strong>and</strong> India)<br />
• Better alignment to extreme market cycles (lower breakeven point)<br />
• Development of both divisions to cover their capital costs <strong>and</strong> finance organic<br />
growth with own cash flow<br />
Financial Analysts’ Conference March 23, 2010 <strong>Rieter</strong>-Konzern<br />
37
Measures <strong>for</strong> the way <strong>for</strong>ward<br />
Three directions of impact<br />
• Lower breakeven point / minimize liquidity drain<br />
• Accelerate product innovation<br />
• Take advantage of opportunities in growth markets<br />
Financial Analysts’ Conference March 23, 2010 <strong>Rieter</strong>-Konzern<br />
38
Lowering breakeven point<br />
• Personnel cost / Overhead<br />
• Adjusting of structures: closing of production plants <strong>and</strong> locations / relocation in<br />
low-cost countries<br />
• Lowering product cost<br />
Financial Analysts’ Conference March 23, 2010 <strong>Rieter</strong>-Konzern<br />
39
Textile: Product innovations<br />
Ring-spinning machine<br />
G 312<br />
Developed in Switzerl<strong>and</strong> <strong>and</strong><br />
produced in India <strong>for</strong> the local<br />
market<br />
High efficiency thanks to<br />
multiple spindles (up to 1440)<br />
Higher rotational speed <strong>and</strong><br />
higher production with lower<br />
power consumption<br />
UNIfloc A 11<br />
Bale opener produced in China<br />
<strong>for</strong> the local market <strong>and</strong> global<br />
export<br />
Higher productivity at lower<br />
investment costs. High<br />
flexibility: up to 4 different<br />
grades can be simultaneously<br />
processed<br />
Double head drawframe<br />
RSB-D-22<br />
10-15% higher machine<br />
efficiency than conventional<br />
double-head drawframes<br />
More compact, lower<br />
investment costs<br />
Less energy consumption<br />
Financial Analysts’ Conference March 23, 2010 <strong>Rieter</strong>-Konzern<br />
40
Textile: Market leader in technology components<br />
Components <strong>for</strong> the prespinning<br />
process<br />
Components <strong>for</strong> ring<br />
spinning<br />
Gretener<br />
Spindles <strong>and</strong> spindle<br />
bearings<br />
Drawframes <strong>and</strong> compact<br />
spinning systems EliTe®<br />
<strong>for</strong> short/long fiber OE<br />
boxes <strong>and</strong> spinning parts<br />
Financial Analysts’ Conference March 23, 2010 <strong>Rieter</strong>-Konzern<br />
41
Automotive: Product innovations<br />
Engine bay<br />
Motorkapselungen für das<br />
Akustik- und/oder Wärmemanagement:<br />
Engine encapsulation Weniger <strong>for</strong><br />
Treibstoffverbrauch acoustic <strong>and</strong>/or thermal und<br />
Emissionen management: verbunden lower fuel mit<br />
Geräuschreduktion<br />
consumption <strong>and</strong> emissions<br />
plus less noise<br />
Trunk paneling<br />
The latest <strong>Rieter</strong> Ultra Silent<br />
application: trunk treatment<br />
State-of-the-art: stiffness<br />
combined with weight savings<br />
<strong>and</strong> acoustic insulation<br />
Acoustic insulation<br />
Thanks to intelligent thickness<br />
distribution <strong>Rieter</strong> Ultra Light<br />
optimally combines absorption<br />
<strong>and</strong> insulation.<br />
Significant weight savings<br />
combined with acoustic<br />
insulation<br />
Financial Analysts’ Conference March 23, 2010 <strong>Rieter</strong>-Konzern<br />
42
Automotive: Main production startups in 2009/2010<br />
Ford Focus<br />
Suzuki Swift<br />
Nissan Micra<br />
BMW X1<br />
Financial Analysts’ Conference March 23, 2010 <strong>Rieter</strong>-Konzern<br />
43
Textile: Long-term market prospects are intact<br />
Global fiber consumption exceeds population growth due to increasing prosperity.<br />
China <strong>and</strong> India consume > 60%<br />
2<br />
2<br />
3<br />
3<br />
3<br />
9<br />
1900 1950 2002 2015<br />
Global population (billions)<br />
Pro capita fiber consumption (kg/head)<br />
Global fiber consumption (million tons)<br />
Financial Analysts’ Conference March 23, 2010 <strong>Rieter</strong>-Konzern<br />
6<br />
9<br />
57<br />
7<br />
11<br />
82<br />
44
Automotive: Market development until 2015<br />
Worldwide car production (light vehicles)<br />
2009: 59.1 m vehicles<br />
2015: 88.1 m vehicles<br />
(CAGR: + 6.9%)<br />
15.3<br />
8.6<br />
North America<br />
+78.4%<br />
CAGR: +10.1%<br />
Source: Global Insight, March 8, 2010;<br />
Vehicle production in million; except ASSY DC<br />
CAGR=Compounded Annual Growth Rate<br />
12.0<br />
Western Europe<br />
+27.3%<br />
CAGR: +4.1%<br />
3.7 4.7<br />
South America<br />
+28.9%<br />
CAGR: +4.3%<br />
15.3<br />
Eastern Europe<br />
+50.2%<br />
CAGR: +7.0%<br />
Rest of world<br />
+49.2%<br />
CAGR: +6.9%<br />
India+94.<br />
6%<br />
CAGR: +11.7<br />
Rest of Asia<br />
+43.9%<br />
CAGR: +6.3%<br />
Financial Analysts’ Conference March 23, 2010 <strong>Rieter</strong>-Konzern<br />
4.8<br />
1.7 2.5<br />
7.2<br />
2.4<br />
5.7<br />
4.7<br />
8.3<br />
12.6<br />
19.3<br />
China<br />
+53.0%<br />
CAGR: +7.4%<br />
7.7<br />
10.8<br />
Japan<br />
+41.0%<br />
CAGR: +5.9%<br />
45
And the future <strong>for</strong> the <strong>Rieter</strong> Group?<br />
• Development of both divisions to cover their capital costs <strong>and</strong> finance organic<br />
growth with own cash flow<br />
• Further lowering of breakeven point, secure cash flow <strong>and</strong> equity<br />
• Spurring product innovations <strong>for</strong> the growing markets China <strong>and</strong> India<br />
Return to profitability with both divisions <strong>and</strong> the Group<br />
Financial Analysts’ Conference March 23, 2010 <strong>Rieter</strong>-Konzern 46
Outlook<br />
Market development<br />
• Textile Systems: significant further improvement of order intake in the initial months of the<br />
current year compared with HY2 09<br />
• Automotive Systems: sales in the initial months of the current year above the average level<br />
of HY2 09<br />
• Sales development is encouraging, but much lower than the record level of 2005 to 2007<br />
Prospects <strong>for</strong> 2010<br />
• If positive consumer sentiment in Europe <strong>and</strong> the USA continues <strong>and</strong> economic growth<br />
expectations in the major Asian markets are confirmed, <strong>Rieter</strong> expects significant sales<br />
growth at group level in 2010 compared to 2009 (compared with the low prior year level)<br />
• During the course of 2010 both the <strong>Rieter</strong> divisions will further lower the breakeven point<br />
thanks to the restructuring measures taken.<br />
• As announced in summer 2009, <strong>Rieter</strong> is confident of achieving the turnaround in 2010.<br />
Financial Analysts’ Conference March 23, 2010 <strong>Rieter</strong>-Konzern<br />
47
<strong>Rieter</strong> Corporate Values <strong>and</strong> Principles<br />
Financial Analysts’ Conference March 23, 2010 <strong>Rieter</strong>-Konzern<br />
48
Disclaimer<br />
<strong>Rieter</strong> is making great ef<strong>for</strong>ts to include accurate <strong>and</strong> up-to-date in<strong>for</strong>mation in this document,<br />
however we make no representations or warranties, expressed or implied, as to the accuracy or<br />
completeness of the in<strong>for</strong>mation provided in this document <strong>and</strong> we disclaim any liability<br />
whatsoever <strong>for</strong> the use of it.<br />
The in<strong>for</strong>mation provided in this document is not intended nor may be construed as an offer or<br />
solicitation <strong>for</strong> the purchase or disposal, trading or any transaction in any <strong>Rieter</strong> securities.<br />
Investors must not rely on this in<strong>for</strong>mation <strong>for</strong> investment decisions.<br />
All statements in this report which do not reflect historical facts are statements related to the<br />
future which offer no guarantee with regard to future per<strong>for</strong>mance; they are subject to risks <strong>and</strong><br />
uncertainties including, but not limited to, future global economic conditions, exchange rates,<br />
legal provisions, market conditions, activities by competitors <strong>and</strong> other factors outside the<br />
company's control.<br />
Financial Analysts’ Conference March 23, 2010 <strong>Rieter</strong>-Konzern<br />
© 2010, <strong>Rieter</strong> Holding Ltd., All rights reserved<br />
49


