Templates and Guidelines for PowerPoint - Rieter
Templates and Guidelines for PowerPoint - Rieter
Templates and Guidelines for PowerPoint - Rieter
You also want an ePaper? Increase the reach of your titles
YUMPU automatically turns print PDFs into web optimized ePapers that Google loves.
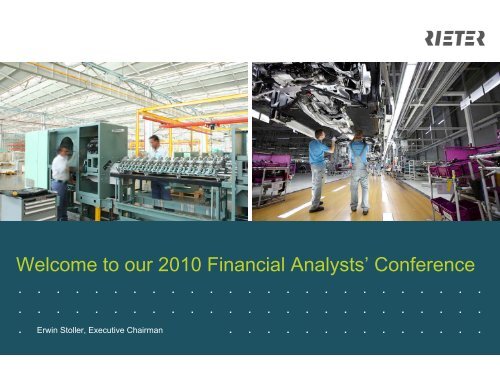
Welcome to our 2010 Financial Analysts’ Conference<br />
. . . . . . . . . . . . . . . . . . . . . . . . .<br />
. . . . . . . . . . . . . . . . . . . . . . . . .<br />
. Erwin . . Stoller, . Executive . . Chairman<br />
. . . . . . . . . . . . . . . . . . .
Agenda<br />
• Introduction Erwin Stoller, Executive Chairman<br />
• Review of business year 2009 Urs Leinhäuser, Chief Financial Officer<br />
• Outlook Erwin Stoller, Executive Chairman<br />
Financial Analysts’ Conference March 23, 2010 <strong>Rieter</strong>-Konzern<br />
2
Massive sales decline led to operating losses<br />
• Difficult market conditions <strong>for</strong> both divisions<br />
• Sales 38% lower than prior year <strong>and</strong> 50% lower than 2007<br />
• Operating losses despite drastic adjustments<br />
Financial Analysts’ Conference March 23, 2010 <strong>Rieter</strong>-Konzern<br />
3
Textile industry: market slump in spinning machinery<br />
Spindle Equiv. Shipments (in million)<br />
20<br />
18<br />
16<br />
14<br />
12<br />
10<br />
8<br />
6<br />
4<br />
2<br />
0<br />
1990<br />
1992<br />
All others<br />
SE Asia<br />
India<br />
China<br />
1994<br />
1996<br />
1998<br />
2000<br />
2002<br />
China Boom<br />
Shipments: 1 Rotor = 6 Ringspindle equivalents;; 1 Airjet = 20 Ringspindle equiv.<br />
Source: Gherzi / DT Marketing<br />
Financial Analysts’ Conference March 23, 2010 <strong>Rieter</strong>-Konzern<br />
2004<br />
India Boom<br />
2006<br />
< Actuals Forecast ><br />
2008<br />
2010<br />
2012<br />
2014<br />
4
Automotive industry: global car production (light<br />
vehicles)<br />
100<br />
90<br />
80<br />
70<br />
60<br />
50<br />
40<br />
30<br />
20<br />
10<br />
in million. < Actuals Forecast ><br />
0<br />
1996 1998 2000 2002 2004 2006 2008 2010 2012 2014<br />
Western Europe<br />
South America<br />
North America<br />
Eastern Europe<br />
Japan<br />
India<br />
China<br />
Rest of Asia<br />
Rest of the world<br />
Source: Global Insight, March 8, 2010<br />
Financial Analysts’ Conference March 23, 2010 <strong>Rieter</strong>-Konzern<br />
5
What have we achieved in 2009?<br />
• Measures implemented to financially stabilize the group<br />
• Breakeven point lowered <strong>and</strong> capacities reduced<br />
• Product innovation spurred<br />
Financial Analysts’ Conference March 23, 2010 <strong>Rieter</strong>-Konzern<br />
6
Severe test passed successfully in 2009<br />
• Corporate financing safeguarded, losses halved in HY2<br />
• In spite of massive redundancies no key people lost<br />
• In both divisions <strong>Rieter</strong> has fully benefited from market recovery since mid 2009<br />
“Severe test successfully faced thanks to the strenuous<br />
ef<strong>for</strong>ts <strong>and</strong> commitment of all <strong>Rieter</strong> people <strong>and</strong> the<br />
confidence of <strong>Rieter</strong> shareholders”<br />
Financial Analysts’ Conference March 23, 2010 <strong>Rieter</strong>-Konzern<br />
7
Review of the business year 2009<br />
. . . . . . . . . . . . . . . . . . . . . . . . .<br />
. . . . . . . . . . . . . . . . . . . . . . . . .<br />
. Urs . Leinhäuser, . . . Chief . Financial . . Officer<br />
. . . . . . . . . . . . . . . . .
Financial key figures 2009<br />
• Sales 2007-2009 -50%<br />
• Operating result -187 million CHF (prior year -312 million CHF)<br />
• Net result -218 million CHF (prior year -397 million CHF)<br />
• Equity ratio 36.1% (prior year 35.7%)<br />
• Net liquidity +10 million CHF (prior year -37 million CHF)<br />
• Restructuring 2008 - 2009 -2361 employees (FTE)<br />
• Change HY2 09 vs. HY1 09<br />
• Orders received +30%<br />
• Sales +17%<br />
• Operating result (EBIT) +87 million CHF<br />
Financial Analysts’ Conference March 23, 2010 <strong>Rieter</strong>-Konzern<br />
9
Orders received per half-year<br />
million CHF<br />
2'000<br />
1'500<br />
1'000<br />
500<br />
0<br />
2008: 2‘561<br />
1'559<br />
1'002<br />
-24%<br />
2009: 1‘935<br />
840<br />
1'095<br />
HY1 08 HY2 08 HY1 09 HY2 09<br />
• Overall sales decline 626<br />
million CHF or 24% in 2009<br />
• Orders received in HY2 09 9%<br />
higher than in HY2 08 <strong>and</strong><br />
30% higher than in HY1 09<br />
• Significantly more orders<br />
received in both divisions<br />
• Orders received vs. sales<br />
(book-to-bill ratio) >1 as of<br />
HY2 2009<br />
Financial Analysts’ Conference March 23, 2010 <strong>Rieter</strong>-Konzern<br />
10
Orders received per half-year by division<br />
million CHF<br />
2009: 511<br />
2009: 1‘424<br />
• Positive trend with<br />
Textile Systems since<br />
Q2 09, <strong>and</strong> with<br />
1'200<br />
1'142<br />
Automotive Systems<br />
since Q3 09<br />
1'000<br />
800<br />
600<br />
400<br />
200<br />
0<br />
417<br />
122<br />
190<br />
321<br />
Financial Analysts’ Conference March 23, 2010 <strong>Rieter</strong>-Konzern<br />
880<br />
650<br />
774<br />
HY1 08 HY2 08 HY1 09 HY2 09 HY1 08 HY2 08 HY1 09 HY2 09<br />
Textile Systems Automotive Systems<br />
• Textile Systems orders<br />
69% higher in HY2 than<br />
in HY1 09<br />
• Also <strong>for</strong> Automotive<br />
Systems, better market<br />
conditions in HY2;<br />
<strong>for</strong> Automotive Orders<br />
received = sales<br />
11
Sales per half-year<br />
million CHF<br />
2'000<br />
1'500<br />
1'000<br />
500<br />
0<br />
2008: 3‘143<br />
1'807<br />
1'336<br />
-38%<br />
2009: 1‘956<br />
900<br />
1'056<br />
HY1 08 HY2 08 HY1 09 HY2 09<br />
• Marked sales decline in 2009<br />
of 1187 million CHF or 38%<br />
• Downturn bottomed out in<br />
HY1 2009<br />
• Sales in HY2 09 17% higher<br />
than in HY1 09<br />
Financial Analysts’ Conference March 23, 2010 <strong>Rieter</strong>-Konzern<br />
12
Sales per half-year by division<br />
million CHF<br />
1'200<br />
1'000<br />
800<br />
600<br />
400<br />
200<br />
0<br />
665<br />
455<br />
2009: 532 2009: 1‘424<br />
• Textile Systems sales 27%<br />
1'142<br />
(prior year 36%) of Group<br />
sales, Automotive Systems<br />
73% (prior year 64%);<br />
Textile Systems more<br />
880<br />
seriously affected by<br />
774 recession<br />
250<br />
282<br />
Financial Analysts’ Conference March 23, 2010 <strong>Rieter</strong>-Konzern<br />
650<br />
HY1 08 HY2 08 HY1 09 HY2 09 HY1 08 HY2 08 HY1 09 HY2 09<br />
Textile Systems<br />
Automotive Systems<br />
• In both divisions downturn<br />
bottomed out in HY1<br />
• Textile Systems sales in<br />
HY2 13% higher than in<br />
HY1<br />
• Automotive Systems sales<br />
in HY2 19% higher than in<br />
HY1<br />
13
Sales development by region<br />
million CHF<br />
2'000<br />
1'600<br />
1'200<br />
800<br />
400<br />
0<br />
1'505<br />
-38%<br />
936<br />
Europe +<br />
Africa<br />
791<br />
-49%<br />
405<br />
589<br />
-26%<br />
433<br />
Asia North<br />
America<br />
257<br />
-29%<br />
Financial Analysts’ Conference March 23, 2010 <strong>Rieter</strong>-Konzern<br />
182<br />
Latin<br />
America<br />
2008<br />
2009<br />
• Strong global presence<br />
maintained<br />
• All regions affected by the<br />
global recession<br />
• Steepest decline in Asia<br />
due to weak dem<strong>and</strong> <strong>for</strong><br />
textile machinery<br />
14
Operating result be<strong>for</strong>e special charges, per half-year<br />
million CHF<br />
150<br />
100<br />
50<br />
0<br />
-50<br />
-100<br />
-150<br />
-200<br />
2008: 22 -209<br />
2009: -187<br />
89<br />
-67<br />
-137<br />
• 2009: first negative Group<br />
operating result (be<strong>for</strong>e<br />
special charges) since a very<br />
long time<br />
• Above all HY1 was still<br />
seriously affected by adverse<br />
market conditions<br />
• Operating loss in HY2 less<br />
than half of HY1 loss thanks<br />
to improvements in both<br />
divisions<br />
• Restructuring <strong>and</strong> cost<br />
reductions brought first<br />
results in HY2<br />
• Breakeven point further<br />
lowered<br />
• Operating result in HY2<br />
also affected positively by<br />
volumes<br />
Financial Analysts’ Conference March 23, 2010 <strong>Rieter</strong>-Konzern<br />
-50<br />
HY1 HY2 HY1 HY2<br />
15
Operating result (EBIT) by division per half-year<br />
million CHF<br />
100<br />
50<br />
0<br />
-50<br />
-100<br />
-150<br />
-200<br />
-250<br />
-300<br />
-350<br />
-400<br />
19<br />
55<br />
-105<br />
-270<br />
-58<br />
-78<br />
-15<br />
-27<br />
HY1 HY2 HY1 HY2<br />
Textile Systems Automotive Systems<br />
¹ ) Group<br />
2008: -312 ¹ ) 2009: -187 ¹ )<br />
+125<br />
• EBIT better than in prior year<br />
due to absence of special<br />
charges<br />
• Special charges in 2008:<br />
mainly <strong>for</strong> restructuring <strong>and</strong><br />
goodwill impairment<br />
• Textile: 91 million CHF<br />
• Automotive: 244 million CHF<br />
• Special charges in 2009:<br />
none<br />
• EBIT in HY2 still negative, but<br />
significantly improved<br />
Financial Analysts’ Conference March 23, 2010 <strong>Rieter</strong>-Konzern<br />
16
Restructuring: Progress of program<br />
In Implementation<br />
69<br />
38<br />
Finished 31<br />
Number of<br />
restructuring<br />
projects<br />
• Adjustment of plant structures in North America <strong>and</strong><br />
Western Europe – Five plant closures <strong>and</strong> downsizing<br />
of several plants achieved, further ones in<br />
implementation<br />
• Simplification of the organization <strong>and</strong> reduction of<br />
overhead costs – Re-organization at group level<br />
<strong>and</strong> in both divisions implemented, further progress<br />
in cost reduction<br />
• Leaner legal structure – Number of legal units<br />
reduced by 10%<br />
• Majority of projects will be finished in 2010 <strong>and</strong><br />
bring full savings impact in 2011<br />
Financial Analysts’ Conference March 23, 2010 <strong>Rieter</strong>-Konzern<br />
17
Restructuring: utilization of provisions<br />
million CHF 2009 2008<br />
Provisions per<br />
December 31 of prior<br />
year<br />
Reclassification<br />
Utilization<br />
Additions, net<br />
183.6<br />
-9.8<br />
-41.4<br />
Currency effects 0.1 -3.4<br />
Provisions per<br />
December 31<br />
-<br />
132.5 183.6<br />
• Restructuring provisions <strong>for</strong><br />
personnel reductions, plant<br />
closures <strong>and</strong> downsizing<br />
• Utilization according to plan<br />
• Provisions utilized were<br />
practically compensated by<br />
the resultant cost reductions<br />
• The remaining provisions of<br />
133 million CHF are adequate<br />
<strong>for</strong> the restructuring needs<br />
still outst<strong>and</strong>ing<br />
• All remaining restructuring<br />
projects are in course of<br />
implementation<br />
Financial Analysts’ Conference March 23, 2010 <strong>Rieter</strong>-Konzern<br />
4.4<br />
-<br />
-33.2<br />
215.8<br />
18
Restructuring: personnel reductions<br />
Full time equivalent (FTE) reductions including temporary staff<br />
4'500<br />
4'000<br />
3'500<br />
3'000<br />
2'500<br />
2'000<br />
1'500<br />
1'000<br />
500<br />
0<br />
2'250<br />
Announced<br />
in August<br />
2008<br />
1'500<br />
Announced<br />
in August<br />
2009<br />
3'750<br />
Restruct.<br />
plan<br />
1'130<br />
Implem.<br />
in 2008<br />
1'230<br />
Implem.<br />
in 2009<br />
2360<br />
=63%<br />
1'390<br />
Ongoing<br />
2010-2011<br />
• In two stages a total of 3750<br />
job reductions was<br />
announced<br />
• 63% of these took place in<br />
2009<br />
• The remaining reductions will<br />
take place mainly in 2010,<br />
continuing into 2011.<br />
• The restructuring plan will be<br />
implemented as announced<br />
• This restructuring plan helps<br />
to improve our footprint <strong>and</strong><br />
to lower the breakeven point<br />
Financial Analysts’ Conference March 23, 2010 <strong>Rieter</strong>-Konzern<br />
19
Net result<br />
million CHF 2009 2008<br />
Operating result be<strong>for</strong>e<br />
special charges -186.6 22.4<br />
Special charges 0 -334.5<br />
Operating result be<strong>for</strong>e<br />
interest <strong>and</strong> taxes<br />
(EBIT)<br />
Financial result<br />
Net result<br />
be<strong>for</strong>e taxes<br />
Taxes<br />
Net result<br />
-186.6<br />
-24.9<br />
-211.5<br />
-6.0<br />
-217.5<br />
-312.1<br />
-64.7<br />
-376.8<br />
-19.9<br />
-396.7<br />
• Net result 2009 very negative,<br />
but 179 million CHF better<br />
than prior year<br />
• Improvement attributable to<br />
the absence of special<br />
charges, a better financial<br />
result <strong>and</strong> lower taxes<br />
• Better financial result due to<br />
no more losses on sale of<br />
securities<br />
Financial Analysts’ Conference March 23, 2010 <strong>Rieter</strong>-Konzern<br />
20
Net result per half-year<br />
million CHF<br />
50<br />
0<br />
-50<br />
-100<br />
-150<br />
-200<br />
-250<br />
-300<br />
-350<br />
-400<br />
-450<br />
-500<br />
41<br />
2008: -397<br />
-438<br />
+179<br />
-146<br />
2009: -218<br />
-72<br />
HY1 HY2 HY1 HY2<br />
• After 2008, net result <strong>for</strong> 2009<br />
again very negative<br />
• Net result 179 million CHF better<br />
than in prior year, mainly due to<br />
better financial result <strong>and</strong><br />
absence of special charges<br />
• Net losses in HY1 halved in HY2,<br />
mainly due to lower operating<br />
losses<br />
Financial Analysts’ Conference March 23, 2010 <strong>Rieter</strong>-Konzern<br />
21
Capital expenditures <strong>and</strong> depreciation by division per<br />
half-year<br />
million CHF<br />
160<br />
140<br />
120<br />
100<br />
80<br />
60<br />
40<br />
20<br />
0<br />
141<br />
85<br />
53<br />
100<br />
53<br />
Capex 08 Deprec.<br />
2008<br />
-13 -79<br />
154<br />
62<br />
56<br />
6<br />
141<br />
94<br />
46<br />
Capex 09 Deprec.<br />
2009<br />
Textile Systems Automotive Systems<br />
• 79 million CHF (56 %) less<br />
capex than in 2008<br />
• Capex in by both divisions<br />
were scrutinized <strong>and</strong><br />
prioritized <strong>for</strong> only the most<br />
important projects<br />
• Strong position of the<br />
divisions not affected by<br />
reductions<br />
• Excess depreciation totaled<br />
79 million CHF in 2009, i.e.<br />
only 44% of depreciations<br />
reinvested<br />
• Capex volumes cannot be<br />
held at this low level<br />
Financial Analysts’ Conference March 23, 2010 <strong>Rieter</strong>-Konzern<br />
22
Net working capital<br />
million CHF 31.12.09 31.12.08<br />
Inventories<br />
Trade receivables<br />
Other receivables<br />
Trade payables<br />
Advance payments by<br />
customers<br />
Other current liabilities<br />
Net working capital<br />
266.0 361.3<br />
331.5<br />
99.4<br />
-226.8<br />
-63.3<br />
-387.3<br />
19.5<br />
382.1<br />
125.9<br />
-268.5<br />
-74.3<br />
-382.7<br />
143.8<br />
• Massive reduction of net<br />
working capital by 124<br />
million CHF<br />
• Reduction of inventories by<br />
95 million CHF despite<br />
security stocks <strong>for</strong> plant<br />
closures<br />
• Customer pressure on<br />
payment conditions almost<br />
completely passed on to<br />
suppliers<br />
• Advance payments by<br />
customers still successful<br />
with Textile Systems<br />
Financial Analysts’ Conference March 23, 2010 <strong>Rieter</strong>-Konzern<br />
23
Balance sheet<br />
million CHF 2009 2008<br />
Total assets 1‘814.1 2‘088.9<br />
Non-current assets<br />
(Goodwill<br />
Net working capital<br />
Cash <strong>and</strong> cash<br />
equivalents<br />
886.5<br />
0.0<br />
19.5<br />
217.7<br />
Marketable securities 13.0 7.7<br />
Financial debt<br />
Shareholders’ equity<br />
222.4<br />
655.8<br />
929.3<br />
In % of total assets 36.1 35.7<br />
Financial Analysts’ Conference March 23, 2010 <strong>Rieter</strong>-Konzern<br />
0.0)<br />
143.8<br />
282.6<br />
327.1<br />
746.2<br />
• Financial basis still sound<br />
• Equity ratio slightly improved<br />
thanks to assets reduction<br />
• Shareholder option plan <strong>and</strong><br />
sale of treasury shares to<br />
PCS Holding strengthened<br />
balance sheet by 103 million<br />
CHF<br />
• Goodwill already written off<br />
in 2008; no new goodwill in<br />
2009<br />
• Drastic reduction of net<br />
working capital<br />
• High amount of cash <strong>and</strong><br />
cash equivalents again per<br />
year-end<br />
• Lower financial debt, but<br />
committed credit lines<br />
24
Equity<br />
million CHF<br />
900<br />
800<br />
700<br />
600<br />
500<br />
400<br />
300<br />
200<br />
100<br />
0<br />
Equity Group<br />
result<br />
746<br />
-218<br />
Participation<br />
PCS<br />
56<br />
Shareholder<br />
option plan<br />
Currency<br />
effects<br />
Other Equity<br />
31.12.2008 31.12.2009<br />
Financial Analysts’ Conference March 23, 2010 <strong>Rieter</strong>-Konzern<br />
47<br />
6<br />
19<br />
656<br />
25
Free cash flow<br />
million CHF 2009 2008<br />
Net result -217.5<br />
Cash flow -93.0 -102.4<br />
Net cash flow -143.3 -69.9<br />
+/- Change in net working capital 141.7 127.1<br />
+/- Capital expenditure, net -45.4 -118.7<br />
+/- Investments in financial assets,<br />
net<br />
Financial Analysts’ Conference March 23, 2010 <strong>Rieter</strong>-Konzern<br />
-4.3<br />
-396.7<br />
-9.2<br />
+/- Change in securities -5.6 58.9<br />
+/- Divestments 22.1 41.7<br />
+/- Acquisitions 0.0 -8.5<br />
Free cash flow -34.8 21.4<br />
• Further reduction of net<br />
working capital<br />
• Heavy reduction of capital<br />
expenditure<br />
• Divestment of a subsidiary<br />
(22 million CHF)<br />
26
Development of net liquidity in 2009<br />
million CHF<br />
40<br />
30<br />
20<br />
10<br />
0<br />
-10<br />
-20<br />
-30<br />
-40<br />
-50<br />
-60<br />
-70<br />
-80<br />
-90<br />
-37<br />
Net liquidity<br />
-35<br />
Free<br />
cash flow<br />
+56<br />
Sale of<br />
treasury<br />
shares<br />
Currency<br />
effects<br />
31.12.2008 31.12.2009<br />
Financial Analysts’ Conference March 23, 2010 <strong>Rieter</strong>-Konzern<br />
+47<br />
Shareholder<br />
option plan<br />
-21<br />
+10<br />
Net liquidity<br />
27
Textile Systems 2009<br />
Leading global systems supplier <strong>for</strong> the entire spinning process<br />
Financial Analysts’ Conference March 23, 2010 <strong>Rieter</strong>-Konzern<br />
28
Textile Systems: Order intake<br />
Mio. CHF<br />
1'200<br />
1'000<br />
800<br />
600<br />
400<br />
200<br />
0<br />
2007: 1‘703 2008: 539 2009: 511<br />
1'084<br />
619<br />
417<br />
122<br />
190<br />
321<br />
HY1 HY2 HY1 HY2 HY1 HY2<br />
• Steep market downturn from<br />
March 2008 until mid-2009<br />
• Bottomed out in Q1 2009<br />
• Already in Q2 2009<br />
significantly higher dem<strong>and</strong><br />
<strong>for</strong> components<br />
• Dem<strong>and</strong> in HY2 69% higher<br />
than in HY1 2009<br />
• Biggest dem<strong>and</strong> in India,<br />
China <strong>and</strong> Turkey<br />
• Orders received vs. sales<br />
(book-to-bill ratio) >1 as of<br />
HY2<br />
Financial Analysts’ Conference March 23, 2010 <strong>Rieter</strong>-Konzern<br />
29
Textile Systems: Sales<br />
Mio. CHF<br />
1'000<br />
800<br />
600<br />
400<br />
200<br />
0<br />
2007: 1‘567 2008: 1‘120 2009: 532<br />
706<br />
861<br />
665<br />
455<br />
-53%<br />
250<br />
282<br />
HY1 HY2 HY1 HY2 HY1 HY2<br />
• Marked sales decline by<br />
53% or 588 million CHF due<br />
to lower order intake in prior<br />
period<br />
• Sales in HY2 13% higher<br />
than in HY1 due to more<br />
orders received as of<br />
summer 2009<br />
• Highest sales in China,<br />
India, Brazil <strong>and</strong> Turkey<br />
• Spare parts business less<br />
affected by downturn than<br />
machinery business<br />
Financial Analysts’ Conference March 23, 2010 <strong>Rieter</strong>-Konzern<br />
30
Textile Systems: Operating result be<strong>for</strong>e special<br />
charges, interest <strong>and</strong> tax<br />
Mio. CHF<br />
100<br />
50<br />
0<br />
-50<br />
-100<br />
2008: 41 2009: -73<br />
55<br />
-14<br />
-58<br />
-15<br />
HY1 HY2 HY1 HY2<br />
• 2009; first negative operating<br />
result be<strong>for</strong>e special charges<br />
since a very long time<br />
• Result affected by massive<br />
collapse of volumes <strong>and</strong> low<br />
workloads<br />
• Loss in HY2 09 greatly<br />
reduced from –58 to –15<br />
million CHF, thanks to<br />
restructuring, cost reductions<br />
<strong>and</strong> slightly higher volumes<br />
in HY2<br />
• Breakeven point significantly<br />
lowered<br />
• Same loss in HY2 09 as in<br />
HY2 08 despite 173 million<br />
CHF less sales in HY2,<br />
thanks to lower breakeven<br />
point<br />
Financial Analysts’ Conference March 23, 2010 <strong>Rieter</strong>-Konzern<br />
31
Automotive Systems 2009<br />
Leading automotive supplier <strong>for</strong> acoustics <strong>and</strong> thermal management<br />
Financial Analysts’ Conference March 23, 2010 <strong>Rieter</strong>-Konzern<br />
32
Automotive Systems: Sales<br />
million CHF<br />
1'400<br />
1'200<br />
1'000<br />
800<br />
600<br />
400<br />
200<br />
0<br />
2007: 2‘363 2008: 2‘022<br />
1214<br />
1149<br />
1142<br />
880<br />
-30%<br />
2009: 1‘424<br />
650<br />
774<br />
HY1 HY2 HY1 HY2 HY1 HY2<br />
• Steep decline of vehicle<br />
production in <strong>Rieter</strong>’s main<br />
markets<br />
• Automotive sales declined<br />
by about 600 million CHF or<br />
30% from prior year (–26%<br />
in local currencies)<br />
• In HY2 <strong>Rieter</strong> Automotive<br />
benefited from rather<br />
friendlier market conditions<br />
• Divisional sales 19% higher<br />
in HY2 than in HY1<br />
Financial Analysts’ Conference March 23, 2010 <strong>Rieter</strong>-Konzern<br />
33
Automotive Systems: Sales by customer groups<br />
Toyota<br />
8%<br />
Chrysler<br />
2%<br />
Mercedes<br />
4%<br />
Honda<br />
7%<br />
Fiat<br />
7%<br />
Trucks<br />
6%<br />
BMW<br />
11%<br />
Other<br />
5%<br />
Nissan<br />
5%<br />
TATA<br />
2%<br />
GM<br />
6%<br />
Renault<br />
7%<br />
• Broadly based customer<br />
portfolio<br />
• <strong>Rieter</strong> supplies all leading<br />
automobile manufacturers<br />
worldwide<br />
• Lower sales to Chrysler <strong>and</strong><br />
GM compensated by<br />
additional orders from Ford<br />
Financial Analysts’ Conference March 23, 2010 <strong>Rieter</strong>-Konzern<br />
PSA<br />
10%<br />
Volvo<br />
5%<br />
VW<br />
4%<br />
Ford<br />
11%<br />
34
Automotive Systems: Operating result be<strong>for</strong>e special<br />
charges, interest <strong>and</strong> tax<br />
million CHF<br />
100<br />
50<br />
0<br />
-50<br />
-100<br />
2008: -7<br />
39<br />
-46<br />
2009: -105<br />
-78<br />
-27<br />
HY1 HY2 HY1 HY2<br />
• Result affected by massive<br />
decline in volume, mainly in<br />
HY1<br />
• Restructuring <strong>and</strong><br />
outsourcing to low-cost<br />
countries start to improve<br />
results<br />
• In HY2 the operating result<br />
be<strong>for</strong>e special charges<br />
improved to -27 million CHF,<br />
compared to -78 million CHF<br />
in HY1<br />
• 19 million CHF less loss in<br />
HY2 09 than in HY2 08,<br />
despite sales decline by<br />
more than 100 million CHF,<br />
thanks to lower breakeven<br />
point<br />
Financial Analysts’ Conference March 23, 2010 <strong>Rieter</strong>-Konzern<br />
35
Outlook<br />
. . . . . . . . . . . . . . . . . . . . . . . . .<br />
. . . . . . . . . . . . . . . . . . . . . . . . .<br />
. Erwin . . Stoller, . Executive . . Chairman<br />
. . . . . . . . . . . . . . . . . . .
<strong>Rieter</strong> Group: Further development<br />
• Expansion in the Asian growth markets (China <strong>and</strong> India)<br />
• Better alignment to extreme market cycles (lower breakeven point)<br />
• Development of both divisions to cover their capital costs <strong>and</strong> finance organic<br />
growth with own cash flow<br />
Financial Analysts’ Conference March 23, 2010 <strong>Rieter</strong>-Konzern<br />
37
Measures <strong>for</strong> the way <strong>for</strong>ward<br />
Three directions of impact<br />
• Lower breakeven point / minimize liquidity drain<br />
• Accelerate product innovation<br />
• Take advantage of opportunities in growth markets<br />
Financial Analysts’ Conference March 23, 2010 <strong>Rieter</strong>-Konzern<br />
38
Lowering breakeven point<br />
• Personnel cost / Overhead<br />
• Adjusting of structures: closing of production plants <strong>and</strong> locations / relocation in<br />
low-cost countries<br />
• Lowering product cost<br />
Financial Analysts’ Conference March 23, 2010 <strong>Rieter</strong>-Konzern<br />
39
Textile: Product innovations<br />
Ring-spinning machine<br />
G 312<br />
Developed in Switzerl<strong>and</strong> <strong>and</strong><br />
produced in India <strong>for</strong> the local<br />
market<br />
High efficiency thanks to<br />
multiple spindles (up to 1440)<br />
Higher rotational speed <strong>and</strong><br />
higher production with lower<br />
power consumption<br />
UNIfloc A 11<br />
Bale opener produced in China<br />
<strong>for</strong> the local market <strong>and</strong> global<br />
export<br />
Higher productivity at lower<br />
investment costs. High<br />
flexibility: up to 4 different<br />
grades can be simultaneously<br />
processed<br />
Double head drawframe<br />
RSB-D-22<br />
10-15% higher machine<br />
efficiency than conventional<br />
double-head drawframes<br />
More compact, lower<br />
investment costs<br />
Less energy consumption<br />
Financial Analysts’ Conference March 23, 2010 <strong>Rieter</strong>-Konzern<br />
40
Textile: Market leader in technology components<br />
Components <strong>for</strong> the prespinning<br />
process<br />
Components <strong>for</strong> ring<br />
spinning<br />
Gretener<br />
Spindles <strong>and</strong> spindle<br />
bearings<br />
Drawframes <strong>and</strong> compact<br />
spinning systems EliTe®<br />
<strong>for</strong> short/long fiber OE<br />
boxes <strong>and</strong> spinning parts<br />
Financial Analysts’ Conference March 23, 2010 <strong>Rieter</strong>-Konzern<br />
41
Automotive: Product innovations<br />
Engine bay<br />
Motorkapselungen für das<br />
Akustik- und/oder Wärmemanagement:<br />
Engine encapsulation Weniger <strong>for</strong><br />
Treibstoffverbrauch acoustic <strong>and</strong>/or thermal und<br />
Emissionen management: verbunden lower fuel mit<br />
Geräuschreduktion<br />
consumption <strong>and</strong> emissions<br />
plus less noise<br />
Trunk paneling<br />
The latest <strong>Rieter</strong> Ultra Silent<br />
application: trunk treatment<br />
State-of-the-art: stiffness<br />
combined with weight savings<br />
<strong>and</strong> acoustic insulation<br />
Acoustic insulation<br />
Thanks to intelligent thickness<br />
distribution <strong>Rieter</strong> Ultra Light<br />
optimally combines absorption<br />
<strong>and</strong> insulation.<br />
Significant weight savings<br />
combined with acoustic<br />
insulation<br />
Financial Analysts’ Conference March 23, 2010 <strong>Rieter</strong>-Konzern<br />
42
Automotive: Main production startups in 2009/2010<br />
Ford Focus<br />
Suzuki Swift<br />
Nissan Micra<br />
BMW X1<br />
Financial Analysts’ Conference March 23, 2010 <strong>Rieter</strong>-Konzern<br />
43
Textile: Long-term market prospects are intact<br />
Global fiber consumption exceeds population growth due to increasing prosperity.<br />
China <strong>and</strong> India consume > 60%<br />
2<br />
2<br />
3<br />
3<br />
3<br />
9<br />
1900 1950 2002 2015<br />
Global population (billions)<br />
Pro capita fiber consumption (kg/head)<br />
Global fiber consumption (million tons)<br />
Financial Analysts’ Conference March 23, 2010 <strong>Rieter</strong>-Konzern<br />
6<br />
9<br />
57<br />
7<br />
11<br />
82<br />
44
Automotive: Market development until 2015<br />
Worldwide car production (light vehicles)<br />
2009: 59.1 m vehicles<br />
2015: 88.1 m vehicles<br />
(CAGR: + 6.9%)<br />
15.3<br />
8.6<br />
North America<br />
+78.4%<br />
CAGR: +10.1%<br />
Source: Global Insight, March 8, 2010;<br />
Vehicle production in million; except ASSY DC<br />
CAGR=Compounded Annual Growth Rate<br />
12.0<br />
Western Europe<br />
+27.3%<br />
CAGR: +4.1%<br />
3.7 4.7<br />
South America<br />
+28.9%<br />
CAGR: +4.3%<br />
15.3<br />
Eastern Europe<br />
+50.2%<br />
CAGR: +7.0%<br />
Rest of world<br />
+49.2%<br />
CAGR: +6.9%<br />
India+94.<br />
6%<br />
CAGR: +11.7<br />
Rest of Asia<br />
+43.9%<br />
CAGR: +6.3%<br />
Financial Analysts’ Conference March 23, 2010 <strong>Rieter</strong>-Konzern<br />
4.8<br />
1.7 2.5<br />
7.2<br />
2.4<br />
5.7<br />
4.7<br />
8.3<br />
12.6<br />
19.3<br />
China<br />
+53.0%<br />
CAGR: +7.4%<br />
7.7<br />
10.8<br />
Japan<br />
+41.0%<br />
CAGR: +5.9%<br />
45
And the future <strong>for</strong> the <strong>Rieter</strong> Group?<br />
• Development of both divisions to cover their capital costs <strong>and</strong> finance organic<br />
growth with own cash flow<br />
• Further lowering of breakeven point, secure cash flow <strong>and</strong> equity<br />
• Spurring product innovations <strong>for</strong> the growing markets China <strong>and</strong> India<br />
Return to profitability with both divisions <strong>and</strong> the Group<br />
Financial Analysts’ Conference March 23, 2010 <strong>Rieter</strong>-Konzern 46
Outlook<br />
Market development<br />
• Textile Systems: significant further improvement of order intake in the initial months of the<br />
current year compared with HY2 09<br />
• Automotive Systems: sales in the initial months of the current year above the average level<br />
of HY2 09<br />
• Sales development is encouraging, but much lower than the record level of 2005 to 2007<br />
Prospects <strong>for</strong> 2010<br />
• If positive consumer sentiment in Europe <strong>and</strong> the USA continues <strong>and</strong> economic growth<br />
expectations in the major Asian markets are confirmed, <strong>Rieter</strong> expects significant sales<br />
growth at group level in 2010 compared to 2009 (compared with the low prior year level)<br />
• During the course of 2010 both the <strong>Rieter</strong> divisions will further lower the breakeven point<br />
thanks to the restructuring measures taken.<br />
• As announced in summer 2009, <strong>Rieter</strong> is confident of achieving the turnaround in 2010.<br />
Financial Analysts’ Conference March 23, 2010 <strong>Rieter</strong>-Konzern<br />
47
<strong>Rieter</strong> Corporate Values <strong>and</strong> Principles<br />
Financial Analysts’ Conference March 23, 2010 <strong>Rieter</strong>-Konzern<br />
48
Disclaimer<br />
<strong>Rieter</strong> is making great ef<strong>for</strong>ts to include accurate <strong>and</strong> up-to-date in<strong>for</strong>mation in this document,<br />
however we make no representations or warranties, expressed or implied, as to the accuracy or<br />
completeness of the in<strong>for</strong>mation provided in this document <strong>and</strong> we disclaim any liability<br />
whatsoever <strong>for</strong> the use of it.<br />
The in<strong>for</strong>mation provided in this document is not intended nor may be construed as an offer or<br />
solicitation <strong>for</strong> the purchase or disposal, trading or any transaction in any <strong>Rieter</strong> securities.<br />
Investors must not rely on this in<strong>for</strong>mation <strong>for</strong> investment decisions.<br />
All statements in this report which do not reflect historical facts are statements related to the<br />
future which offer no guarantee with regard to future per<strong>for</strong>mance; they are subject to risks <strong>and</strong><br />
uncertainties including, but not limited to, future global economic conditions, exchange rates,<br />
legal provisions, market conditions, activities by competitors <strong>and</strong> other factors outside the<br />
company's control.<br />
Financial Analysts’ Conference March 23, 2010 <strong>Rieter</strong>-Konzern<br />
© 2010, <strong>Rieter</strong> Holding Ltd., All rights reserved<br />
49


