North Island College - Ministry of Advanced Education - Government ...
North Island College - Ministry of Advanced Education - Government ...
North Island College - Ministry of Advanced Education - Government ...
- No tags were found...

Create successful ePaper yourself
Turn your PDF publications into a flip-book with our unique Google optimized e-Paper software.
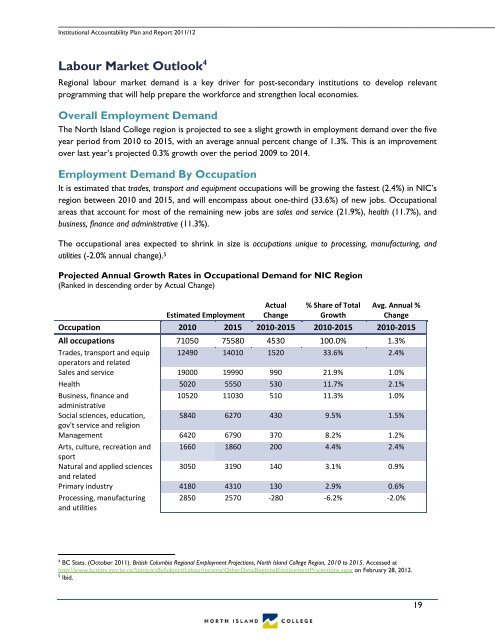
Institutional Accountability Plan and Report 2011/12Labour Market Outlook 4Regional labour market demand is a key driver for post-secondary institutions to develop relevantprogramming that will help prepare the workforce and strengthen local economies.Overall Employment DemandThe <strong>North</strong> <strong>Island</strong> <strong>College</strong> region is projected to see a slight growth in employment demand over the fiveyear period from 2010 to 2015, with an average annual percent change <strong>of</strong> 1.3%. This is an improvementover last year’s projected 0.3% growth over the period 2009 to 2014.Employment Demand By OccupationIt is estimated that trades, transport and equipment occupations will be growing the fastest (2.4%) in NIC’sregion between 2010 and 2015, and will encompass about one-third (33.6%) <strong>of</strong> new jobs. Occupationalareas that account for most <strong>of</strong> the remaining new jobs are sales and service (21.9%), health (11.7%), andbusiness, finance and administrative (11.3%).The occupational area expected to shrink in size is occupations unique to processing, manufacturing, andutilities (-2.0% annual change). 5Projected Annual Growth Rates in Occupational Demand for NIC Region(Ranked in descending order by Actual Change)Estimated EmploymentActualChange% Share <strong>of</strong> TotalGrowthAvg. Annual %ChangeOccupation 2010 2015 2010‐2015 2010‐2015 2010‐2015All occupations 71050 75580 4530 100.0% 1.3%Trades, transport and equip 12490 14010 1520 33.6% 2.4%operators and relatedSales and service 19000 19990 990 21.9% 1.0%Health 5020 5550 530 11.7% 2.1%Business, finance and10520 11030 510 11.3% 1.0%administrativeSocial sciences, education, 5840 6270 430 9.5% 1.5%gov't service and religionManagement 6420 6790 370 8.2% 1.2%Arts, culture, recreation and 1660 1860 200 4.4% 2.4%sportNatural and applied sciences 3050 3190 140 3.1% 0.9%and relatedPrimary industry 4180 4310 130 2.9% 0.6%Processing, manufacturingand utilities2850 2570 ‐280 ‐6.2% ‐2.0%4BC Stats. (October 2011). British Columbia Regional Employment Projections, <strong>North</strong> <strong>Island</strong> <strong>College</strong> Region, 2010 to 2015. Accessed athttp://www.bcstats.gov.bc.ca/StatisticsBySubject/LabourIncome/OtherData/RegionalEmploymentProjections.aspx on February 28, 2012.5Ibid.19