Institutional Accountability Plan and Report 2011/12Socio-Economic Indicators<strong>Education</strong>al Attainment 6While approximately 78% <strong>of</strong> projected total job openings in the future are expected to require somepost-secondary education, both high school graduation rates and post-secondary completion rates arelower in <strong>North</strong> <strong>Island</strong> <strong>College</strong>’s catchment area compared with provincial rates.NIC’s region has a higher percentage <strong>of</strong> 18 year olds who did not graduate (35.5% for 2007/08 to2009/10) compared to BC (29.0%). Within NIC’s region, the secondary school non-completion rate isthe highest in the Mt. Waddington and Alberni-Clayoquot Regional Districts (44% each).The NIC regional trend <strong>of</strong> lower educational attainment levels continues in the post-secondary settingas the percentage <strong>of</strong> 25-54 year olds without post-secondary completion (45.9%) also comparesunfavourably to BC (37.2%).Income – Resource Dependency and Income LevelsThe <strong>North</strong> <strong>Island</strong> <strong>College</strong> region’s traditional dependence on resource-based industries has declined. As<strong>of</strong> 2009, the dominant basic income source across the region was the public sector. For the ComoxValley and northern Central Coast regions this dominance has held steady for over 15 years, while theforestry and wood processing sector has been dominant in the other island regions. Fishing and trapping,and personal investments have dominated in the southern Central Coast. 7Resource dependency remains a factor in our region, with dependence on forestry and wood processingranging from 12% to 26% depending on the district. 8Total income reported by tax filers in 2009 is relatively low in the <strong>North</strong> <strong>Island</strong> <strong>College</strong> region. TheCentral Coast and Alberni-Clayoquot regional districts have an average income per capita <strong>of</strong> $24,419and $32,977 respectively, the lowest two regions in the province. Tax filers in Mount Waddington andComox-Strathcona fare better (ranked 19 th and 15 th <strong>of</strong> 27 regions), with average total incomes <strong>of</strong>$35,388 and $37,444 respectively. 9Income Assistance and Cost <strong>of</strong> LivingPercentages <strong>of</strong> individuals receiving income assistance and employment insurance benefits in the <strong>North</strong><strong>Island</strong> <strong>College</strong> region are among the highest in BC, with NIC’s region ranking fourth and fifth highest out<strong>of</strong> the province’s fifteen college regions (as <strong>of</strong> September 2010). This is an improved ranking from the2009 data, from which the region had been ranked third highest for both indicators.6BC Stats. (2010) <strong>College</strong> Region 11 – <strong>North</strong> <strong>Island</strong>; Statistical Pr<strong>of</strong>ile and the associated Socio-Economic Pr<strong>of</strong>iles 2010 Regional DistrictBackground Data.7Horne, Gary (March 2009). British Columbia Local Area Economic Dependencies: 2006. From graph on page 46, prepared by BC Stats, January2009. Retrieved from http://www.bcstats.gov.bc.ca/Files/788c0316-83ee-45e3-81ce-3352b9d3a76a/BCLocalAreaEconomicDependencies2006.pdf on June 13, 2012. And from appendices to Horne, Gary (February 2009). 2006Economic Dependency Tables for Forest Districts, same graphs prepared by BC Stats in March 2009.8Appendices to Horne, Gary (February 2009). 2006 Economic Dependency Tables for Forest Districts, graphs prepared by BC Stats in March 2009.9BC Stats (August 2011). Labour Force Income Pr<strong>of</strong>ile. Retrieved fromhttp://www.bcstats.gov.bc.ca/StatisticsBySubject/LabourIncome/OtherData/IncomeTaxation.aspx on June 13, 2012.20
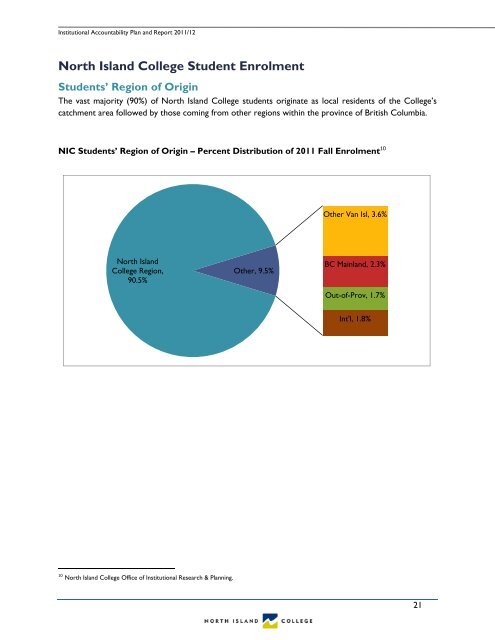
Institutional Accountability Plan and Report 2011/12<strong>North</strong> <strong>Island</strong> <strong>College</strong> Student EnrolmentStudents’ Region <strong>of</strong> OriginThe vast majority (90%) <strong>of</strong> <strong>North</strong> <strong>Island</strong> <strong>College</strong> students originate as local residents <strong>of</strong> the <strong>College</strong>’scatchment area followed by those coming from other regions within the province <strong>of</strong> British Columbia.NIC Students’ Region <strong>of</strong> Origin – Percent Distribution <strong>of</strong> 2011 Fall Enrolment 10Other Van Isl, 3.6%<strong>North</strong> <strong>Island</strong><strong>College</strong> Region,90.5%Other, 9.5%BC Mainland, 2.3%Out-<strong>of</strong>-Prov, 1.7%Int'l, 1.8%10 <strong>North</strong> <strong>Island</strong> <strong>College</strong> Office <strong>of</strong> Institutional Research & Planning.21