TANZANIA TOURISM SECTOR SURVEY - Bank of Tanzania
TANZANIA TOURISM SECTOR SURVEY - Bank of Tanzania
TANZANIA TOURISM SECTOR SURVEY - Bank of Tanzania
- No tags were found...
You also want an ePaper? Increase the reach of your titles
YUMPU automatically turns print PDFs into web optimized ePapers that Google loves.
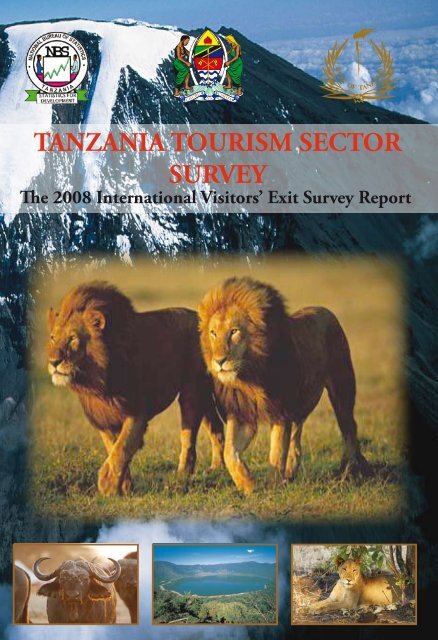
<strong>TANZANIA</strong> <strong>TOURISM</strong> <strong>SECTOR</strong> <strong>SURVEY</strong>The 2008 International Visitors’ Exit Survey ReportDar es Salaam, June 2010
TABLE OF CONTENTSAcronyms.......................................................................................................Foreword........................................................................................................Acknowledgement..........................................................................................Executive summary.........................................................................................List <strong>of</strong> Tables...................................................................................................List <strong>of</strong> Charts..................................................................................................ivvviviixixiiChapter 1: Recent Developments in the Tourism Industry......................... 11.1 Global Perspective............................................................................... 11.2 <strong>Tanzania</strong>n Perspective.......................................................................... 21.2.1 Domestic Tourism............................................................................... 21.2.2 Emerging Source Markets.................................................................... 21.2.3 Legislation.......................................................................................... 31.2.4 Tourism Developments....................................................................... 3Chapter 2: Analysis <strong>of</strong> Survey Results........................................................ 52.0 Introduction........................................................................................ 52.1 Source Markets................................................................................... 52.2 Travel Arrangement............................................................................. 72.3 Age Group.......................................................................................... 102.4 Gender................................................................................................ 112.5 Visitors by Purpose <strong>of</strong> Visit................................................................. 122.6 Length <strong>of</strong> Stay..................................................................................... 162.7 Average Length <strong>of</strong> Stay by Purpose <strong>of</strong> Visit......................................... 192.8 Departure Points................................................................................. 202.9 Expenditure Analysis........................................................................... 212.9.1 Total Expenditure............................................................................... 212.9.2 Average Expenditure........................................................................... 222.9.3 Expenditure at Destination................................................................. 242.10 Areas for Improvement........................................................................ 25Chapter 3: Conclusion and Recommendations.......................................... 263.1 Conclusion......................................................................................... 263.2 Recommendations.............................................................................. 26ii
Appendices.................................................................................................... 28Appendix I: Survey Methodology................................................................... 29i. Introduction............................................................................................ 29ii. Scope <strong>of</strong> the Survey.................................................................................. 29iii. Sample Size.............................................................................................. 29iv. Survey Period........................................................................................... 29v. Survey Coverage...................................................................................... 29vi. Enumerators’ Manual.............................................................................. 30vii. Training <strong>of</strong> Enumerators.......................................................................... 30viii. The Questionnaire................................................................................... 30ix. Data Processing....................................................................................... 30x. Tourist Expenditure Estimation............................................................... 31Appendix II : Questionaire........................................................................... 33References.................................................................................................... 36iii
ACRONYMSATCLBOPBOTFDIILOJNIAKIAMDGsMOFEAMIDMITMMLHHSDMNRTNAMNBSPMO-RALGTAATANAPATICTTSSUNESCOUNWTOURTVFRWHCZAAZATIZCTAir <strong>Tanzania</strong> Company LimitedBalance <strong>of</strong> Payments<strong>Bank</strong> <strong>of</strong> <strong>Tanzania</strong>Foreign Direct InvestmentInternational Labour OrganisationJulius Nyerere International AirportKilimanjaro International AirportMillennium Development GoalsMinistry <strong>of</strong> Finance and Economic AffairsMinistry <strong>of</strong> Infrastructure DevelopmentMinistry <strong>of</strong> Industry, Trade and MarketingMinistry <strong>of</strong> Land, Housing and Human SettlementsDevelopmentMinistry <strong>of</strong> Natural Resources and TourismNamangaNational Bureau <strong>of</strong> StatisticsPrime Minister’s Office- Regional Administration and LocalGovernment<strong>Tanzania</strong> Airport Authority<strong>Tanzania</strong> National Parks<strong>Tanzania</strong> Investment Centre<strong>Tanzania</strong> Tourism Sector SurveyUnited Nations Educational, Scientific and Cultural OrganizationUnited Nations World Tourism OrganisationUnited Republic <strong>of</strong> <strong>Tanzania</strong>Visiting Friends and RelativesWorld Heritage CentreZanzibar AirportZanzibar Association <strong>of</strong> Tourism InvestorsZanzibar Commission for Tourismiv
FOREWORDTourism has continued to play an important role in the <strong>Tanzania</strong>n economy andis rated among the fastest growing sectors in the country. The sector has recordedimproved performance in recent years as evidenced by the increasing number <strong>of</strong>tourist arrivals from 582,807 in 2004 to 770,376 in 2008. Likewise, tourismearnings rose from USD 746.0 million in 2004 to USD 1,288.7 million in 2008.The good performance is largely attributed to the macroeconomic reforms andincreased promotion <strong>of</strong> <strong>Tanzania</strong> as a unique tourist destination.In order to sustain such performance, timely availability <strong>of</strong> accurate informationon tourism is important for policy formulation, planning and investment. Inensuring that information on tourism continues to be available, the multiinstitutional committee which consists <strong>of</strong> the Ministry <strong>of</strong> Natural Resources andTourism (MNRT), <strong>Bank</strong> <strong>of</strong> <strong>Tanzania</strong> (BOT), National Bureau <strong>of</strong> Statistics (NBS),Immigration Department and the Zanzibar Commission for Tourism (ZCT)conducted the International Visitors’ Exit Survey in 2008.The key objective <strong>of</strong> the survey was to collect up-to-date information on touristexpenditure to be used in the “Tourist Expenditure Model” for estimation <strong>of</strong>international tourism receipts for compilation <strong>of</strong> National Accounts (NA) andBalance <strong>of</strong> Payments (BOP) statistics. The survey also aimed at obtaining informationthat is used for strategic planning, tourism promotion and macroeconomic policyformulation.In this regard, we are glad to introduce the 2008 <strong>Tanzania</strong> Tourism Sector Survey(TTSS) Report which provides important tourism statistics such as, tourist earnings,source markets and purposes <strong>of</strong> visit. The report also highlights some areas forimprovement like airport facilities and roads leading to the tourist attractions.It is our expectation that this report will be a useful source <strong>of</strong> information to policymakers, investors, academicians and other stakeholders in the tourism industry.Hon. Shamsa Mwangunga (MP)MinisterMinistry <strong>of</strong> Natural Resources and TourismPr<strong>of</strong>. Benno NduluGovernor<strong>Bank</strong> <strong>of</strong> <strong>Tanzania</strong>v
ACKNOWLEDGEMENTThe Steering Committee <strong>of</strong> the <strong>Tanzania</strong> Tourism Sector Survey (TTSS) wishes toconvey pr<strong>of</strong>ound gratitude to all those who were behind the successful completion<strong>of</strong> the 2008 International Visitors’ Exit Survey. Special appreciation should go to theChief Executives <strong>of</strong> the participating institutions namely; the Ministry <strong>of</strong> NaturalResources and Tourism (MNRT), <strong>Bank</strong> <strong>of</strong> <strong>Tanzania</strong> (BOT), National Bureau <strong>of</strong>Statistics (NBS), Immigration Department, Zanzibar Commission for Tourism(ZCT) and the Tourism Confederation <strong>of</strong> <strong>Tanzania</strong> (TCT) for their valuable supportand guidance.Special recognition should also go to the Immigration Department staff, particularlyOfficers In-charge at the Julius Nyerere International Airport (JNIA) in Dar-essalaam,Zanzibar Airport (ZAA), Kilimanjaro International Airport (KIA), Namangaand Tunduma boarder points. Likewise, our pr<strong>of</strong>ound thanks should go to fieldenumerators and data entrants for making the survey a success.The 2008 International Visitors‘Exit Survey Report was prepared under the overallsupervision <strong>of</strong> Ms M. Mmari (Director <strong>of</strong> Tourism – MNRT) and Dr J. L. Masawe(Director Economic Research and Policy-BOT). The Technical Team was led byI. Mussa (Assistant Director-MNRT) in collaboration with Mrs. G. Mwakibolwa(Manager, International Economics and Trade Department- BOT). Other members<strong>of</strong> the team were P. Mwiru (MNRT), V. Tesha (NBS), T. Mwisomba (NBS), R.Lyatuu (Immigration Department), Dr. C. Masenya (BOT), Mrs V. Kejo (BOT)and M. Jaffer (ZCT), while F. Shayo from BOT managed data processing.vi
EXECUTIVE SUMMARYRationale<strong>Tanzania</strong>, like other developing countries aims at attaining a high economic growthand poverty reduction. This can be achieved by implementing sound macroeconomicreforms, which include conducive investment environment for attracting bothdomestic and foreign investments. So far, achievement has been recorded in sectorslike tourism, where increased investments in accommodation establishmentshave been registered. The improved performance <strong>of</strong> the tourism industry is alsoattributable to the joint efforts taken by the Government and the private sector indeveloping the industry and marketing the country as a unique tourist destination.The sustainability <strong>of</strong> development in the tourism industry depends on the availability<strong>of</strong> reliable tourism information for policy formulation and decision making.In view <strong>of</strong> this, five institutions namely: the Ministry <strong>of</strong> Natural Resources andTourism, <strong>Bank</strong> <strong>of</strong> <strong>Tanzania</strong>, National Bureau <strong>of</strong> Statistics, Immigration Departmentand the Zanzibar Commission for Tourism (ZCT) have been jointly carrying outInternational Visitors’ Exit Surveys. The first comprehensive survey was conductedin 2001, and it was followed by a series <strong>of</strong> short surveys in 2004, 2005, 2006 anda comprehensive survey in 2007. The survey was carried out in December, 2008 atthe five major exit points, namely: the Julius Nyerere International Airport (JNIA),Kilimanjaro International Airport (KIA), Zanzibar Airport (ZAA), Tunduma andNamanga (NAM); which are road border posts.Objectives <strong>of</strong> the SurveyThe International Visitors’ Exit Survey had the following key objectives:• To update information on tourist earnings for improving compilation <strong>of</strong>National Accounts (NA) and Balance <strong>of</strong> Payments (BOP) Statistics.• To set benchmarks for statistics on the tourism industry.• To gather information for tourism promotion and macroeconomic policyformulation.• To provide a basis for construction <strong>of</strong> Tourism Satellite Account (TSA).Survey ManagementThe <strong>Tanzania</strong> Tourism Sector Survey is managed and implemented by the Steeringand Technical Committees, whose members are drawn from the five participatinginstitutions namely: the Ministry <strong>of</strong> National Resources and Tourism, <strong>Bank</strong> <strong>of</strong><strong>Tanzania</strong>, National Bureau <strong>of</strong> Statistics, Immigration Department and the ZanzibarCommission for Tourism.vii
Report StructureThis report is divided into three chapters. The first chapter depicts the recentdevelopments on the Tourism Industry, both at global and national perspective.Analysis <strong>of</strong> survey results is presented in chapter two, while the conclusion andrecommendations are provided in chapter three. The survey methodology is includedas appendix I.Main Findings <strong>of</strong> the Survey<strong>Tanzania</strong> Earned USD 1,288,699,561 from Tourism Activities in 2008Using the Tourist Expenditure model, it is estimated that <strong>Tanzania</strong> earned USD1,288,699,561 in 2008, out <strong>of</strong> which Zanzibar earned USD 160,258,272. Theseearnings accrued from 770,376 and 98,677 international visitor arrivals to <strong>Tanzania</strong>and Zanzibar, respectively. Tourism earnings to Zanzibar were low in 2008 comparedto the previous year, largely due to the Global Financial Crisis which led to a declinein international visitor arrivals.Average ExpenditureThe survey results show that the overall average expenditure for holiday visitors whocame under package arrangement was USD 209 per person per night, while that <strong>of</strong>non package was USD 186 per person per night. The result indicates that overallthe package arrangement tours are relatively more expensive than the non packagetrips due to convenience during travel, safety and ease <strong>of</strong> reservation through travelagents.Length <strong>of</strong> StayThe overall average length <strong>of</strong> stay for visitors to the United Republic <strong>of</strong> <strong>Tanzania</strong>was 10 nights. This is a lower average length <strong>of</strong> stay compared to an average <strong>of</strong> 12nights recorded during the past three years. The decline in the average length <strong>of</strong> stayis partly due to seasonality as the survey was conducted in December (mini-peaktourist season). The average length <strong>of</strong> stay within <strong>Tanzania</strong> Mainland was nine daysand Zanzibar was seven days.Major Tourist Source Markets in <strong>Tanzania</strong>The following are the main source markets for 2008:1. Italy2. United States <strong>of</strong> America3. United Kingdom4. South Africa5. Kenyaviii
The survey results depict the dominance <strong>of</strong> Italy, the United States <strong>of</strong> America andthe United Kingdom as major tourist source markets to <strong>Tanzania</strong>. This is largely dueto enhanced promotional efforts in those countries. Meanwhile, Italy continues tobe the major tourist source market for Zanzibar, following the existence <strong>of</strong> Italianaccommodation investments and direct flights from Italy. The same pattern has alsobeen observed during the previous surveys.The Majority <strong>of</strong> Visitors were <strong>of</strong> ‘25–44’ Age GroupAbout 54 percent <strong>of</strong> the visitors who came to <strong>Tanzania</strong> were in the age group <strong>of</strong>25-44, followed by the age group <strong>of</strong> 45-64. Very few visitors (about 4 percent)were in the age group <strong>of</strong> 65 years and above despite their potentials in the marketsegmentation. This group is characterized by retired people who have ample timeand adequate income for leisure and holiday.The Majority <strong>of</strong> the Visitors Came Under Non-Package ArrangementVisitors who travelled on the ‘non-package’ arrangement were the majority as theyaccounted for 56.2 percent, whereas the ‘package’ visitors accounted for 43.8 percent.These results differ from the outcome <strong>of</strong> the previous surveys, where package tourhas been the most preferred travel arrangement. The change in the pattern <strong>of</strong> tourarrangement during this survey is partly explained by seasonality as the survey wasconducted during the mini-peak tourist season and the Global Financial Crisis whichstarted in the mid 2008.Visitors to <strong>Tanzania</strong> Primarily Came for ‘Leisure and Holiday’ PurposesMost <strong>of</strong> the visitors (62.4 percent) came into the country for leisure and holiday,15.3 percent for Visiting Friends and Relatives (VFR) and 11.9 percent for businesspurpose. The number <strong>of</strong> visitors who came for business and conference continuedto be minimal despite the growing importance <strong>of</strong> Conference Tourism worldwide.In order to address this problem, construction <strong>of</strong> large and modern state-<strong>of</strong>-the-artconference auditoriums to attract international Meetings, Incentives, Conferencesand Exhibitions (MICE) is necessary.Majority <strong>of</strong> Visitors to <strong>Tanzania</strong> Departed Through the Julius NyerereInternational AirportThe Julius Nyerere International Airport (JNIA) was the main gateway <strong>of</strong> touristsdeparting from <strong>Tanzania</strong>, accounting for 46.3 percent <strong>of</strong> the visitors recorded duringthe survey. Zanzibar Airport was the second departure point (26.2 percent) followedby Kilimanjaro International Airport (12.7 percent). Meanwhile, Namanga was theleading road boarder departure point.ix
Visitors are Concerned About the State <strong>of</strong> the Infrastructure and OtherFacilitiesAbout 50.0 percent <strong>of</strong> total visitors called upon the improvement <strong>of</strong> the infrastructureand other facilities. They were seriously concerned with the poor condition <strong>of</strong> theroads leading to Tarangire and Serengeti as well as traffic jams to and from the JuliusNyerere International Airport. Similarly, the visitors were not satisfied with thecondition <strong>of</strong> the airports and their facilities such as the air conditioners, signage andwashrooms.RecommendationsBased on the survey’s results, the following recommendations are given in order toenhance the development <strong>of</strong> the tourism industry in <strong>Tanzania</strong>:1. There is a need to improve roads, airports, and other facilities such as airconditions, signage and washrooms.2. Improve on customer service and procedures for issuance <strong>of</strong> VISA.3. Enhance efforts <strong>of</strong> promoting <strong>Tanzania</strong> as a tourist destination in the emergingsource markets like the Middle East as well as regional markets.4. Upgrade standards in accommodation establishments, especially facilities thatcater for elderly and people with disabilities.5. Construct a large and modern state-<strong>of</strong>-the-art conference auditorium to attractinternational Meetings, Incentives, Conferences and Exhibitions (MICE).x
LIST OF TABLESTable 1.1: Domestic Visitors by Tourist Attractions.................................. 2Table 1.2: Tourist Arrivals by Country...................................................... 3Table 2.1(a): Top 15 Source Markets to <strong>Tanzania</strong>......................................... 5Table 2.1(b): Top 15 Source Markets to Zanzibar......................................... 6Table 2.2(a): Proportion <strong>of</strong> Visitors by Country <strong>of</strong> Residence andTravel Arrangement.................................................................. 8Table 2.2(b): Proportion <strong>of</strong> Visitors by Travel Arrangement andPurpose <strong>of</strong> Visit....................................................................... 8Table 2.2(c): Purpose <strong>of</strong> Visit by Country under the Package Tour Arrangement 9Table 2.2(d): Purpose <strong>of</strong> Visit by Country under the Non-packageTour Arrangement................................................................... 10Table 2.3: Number <strong>of</strong> Respondents by Age Group................................... 10Table 2.4: Interviewees by Purpose <strong>of</strong> Visit and Age Group...................... 14Table 2.5: Purpose <strong>of</strong> Visit by Country (in Percentage)............................. 15Table 2.6(a): Average Length <strong>of</strong> Stay <strong>of</strong> Visitors to <strong>Tanzania</strong>......................... 16Table 2.6(b): Average Length <strong>of</strong> Stay <strong>of</strong> Visitors to the <strong>Tanzania</strong> Mainland... 17Table 2.6 (c): Average Length <strong>of</strong> Stay to Zanzibar for the Top 15 Countries.. 18Table 2.7: Average Length <strong>of</strong> Stay by Purpose <strong>of</strong> Visit for <strong>Tanzania</strong>......... 19Table 2.8: Number <strong>of</strong> Visitors by Departure Points.................................. 21Table: 2.9: Average Holiday Visitor’s Expenditure per Night(Top 15 Source Markets)......................................................... 23Table 2.10: Percentage Distribution <strong>of</strong> Tourists’ Expenditure by Category 24xi
LIST OF CHARTSChart 2.1: Travel Arrangement.................................................................. 7Chart 2.2: Visitors by Gender.................................................................... 11Chart 2.3: Visitors by Purpose <strong>of</strong> Visit....................................................... 12Chart 2.4: Tourism Receipts...................................................................... 22Chart 2.5: Average Expenditure per Night <strong>of</strong> Holiday Makers................... 24Chart 2.6: Visitors’ Comments.................................................................. 25xii
Chapter1Recent Developments in the Tourism Industry1.1 Global PerspectiveTourism continued to play an important role in the global economy and due to itsstrong economic multiplier effect; it embraces small and medium enterprises. Inthis regard, tourism is still one <strong>of</strong> the largest employment sectors in most countriesand a fast entry vehicle into the workforce for young people and women in theurban and rural communities. Likewise, the sector has recorded good performanceon international arrivals and tourist earnings. In 2008, international tourist arrivalsincreased to 924 million from 908 million recorded in 2007. Similarly, tourismearnings from international arrivals increased to USD 944 billion from USD857 billion in 2007 (United Nation World Tourism Organisation - UNWTOestimates).However, due to the Global Financial Crisis (GFC), international tourist arrivalsdeclined by 8 percent between January and April 2009, compared to the same periodin the previous year 2 . All regions, with an exception <strong>of</strong> Africa, recorded declines inarrivals from January through April. The worst hit being Europe (10 percent) andthe Middle East (18 percent), as African region recorded an increase <strong>of</strong> 3 percent.As a way to boost the growth <strong>of</strong> the tourism industry, there is a need to enhance tradepromotion, simplify regulations, build infrastructure and rationalize taxes, which inturn encourage companies to invest, innovate and hence stimulate demand. Thiskind <strong>of</strong> public-private sector collaboration should be strongly enhanced within andbetween all states, as it will help to build resilience and recovery across economies.In line with this, UNWTO has recommended a Roadmap for Recovery, with thefollowing elements:• Harness the power <strong>of</strong> technology and modern communications, including theinternet in order to reduce cost, operate with new efficiencies and manage riskin an environment <strong>of</strong> uncertainty and constant change.• Boost Public/Private Partnership and identify best practice economic andoperational models.• Put Tourism and Travel at the core <strong>of</strong> Stimulus Packages because the jobs andtrade flow form a strong tourism sector. Additionally, business and consumerconfidence in travel can play a big part in any bounce back from recession.2June 09 th edition <strong>of</strong> the UNWTO World Tourism Barometer1
1.2 <strong>Tanzania</strong>n Perspective<strong>Tanzania</strong>’s tourism industry i s thriving and is rated among the fastest growingsectors in the country and it takes a lead in bringing foreign exchange. The tourismindustry continued to grow in 2008, with the number <strong>of</strong> tourist arrivals increasingby 7.4 percent to 770,376, compared to the level recorded in 2007. Similarly,earnings from tourism went up by 8 percent to USD 1,288.7 million. According tothe World Travel and Tourism Council, tourism directly generated 719,000 jobs in2008. During the first half <strong>of</strong> 2009, the tourism industry was affected by the GlobalFinancial Crisis. Available immigration statistics indicate that during January - June,2009, the number <strong>of</strong> international arrivals dropped by 16.5 percent to 303,819,compared to the corresponding period in the previous year. As a way <strong>of</strong> mitigatingthe possible effects <strong>of</strong> GFC, in June 2009 the government <strong>of</strong> <strong>Tanzania</strong> came upwith a stimulus package to bail out agriculture, tourism, mining exploration,manufacturing and gemstones trade.1.2.1 Domestic TourismApart from international tourism, the government <strong>of</strong> <strong>Tanzania</strong> has recognized theimportance <strong>of</strong> domestic tourism in its contribution to economic growth. Both thepublic and private sectors have increased efforts to promote domestic tourism. Theseefforts include advertisements through the media and participation in local fairssuch as “Karibu Travel Fair”, “Nane Nane” and “Saba Saba”. As a way <strong>of</strong> encouragingresidents to visit the national parks, museums’ and antiquities’ entrance fees haveremained low, adults pay TZS 1,500 and children pay TZS 500 to visit the parks,while for museums and antiquities the entrance fees for adults and children are TZS500 and TZS 200, respectively. The number <strong>of</strong> domestic tourists who visited suchattractions has increased to 639,749 from 536,341, recorded in 2007/08 (Table1.1).Table 1.1: Domestic Visitors by Tourist AttractionsAttraction 2007/2008 2008/2009 % changeNational Parks 258,039 280,537 8.7Museums 73,520 92,787 26.2Antiquities Sites 35,039 45,209 29.0Ngorongoro 169,743 221,216 30.3Total 536,341 639,749 19.3Source: Ministry <strong>of</strong> Natural Resource and Tourism2
1.2.2 Emerging Source MarketsSince 2006, the <strong>Tanzania</strong> Tourist Board has been stepping up promotions in newemerging markets <strong>of</strong> China, Japan, Singapore, India and Russia by participating intourism fairs and conducting Road Shows. Table 1.2 shows the number <strong>of</strong> touristarrivals from emerging markets.Table 1.2: Tourist Arrivals by CountryArrivalsCountry 2006 2007 2008China 4,798 6,353 8,982Japan 3,989 4,021 3,890Singapore 320 384 347India 13,020 14,042 17,530Russia 1,415 2,091 2,224Total 23,542 26,855 32,973Source: Ministry <strong>of</strong> Natural Resource and Tourism1.2.3 LegislationThe Tourism Act <strong>of</strong> 2008 was passed by the Parliament and became effective on 1stJuly 2009. Regulations for Tour Operators, Tour Guides, Accommodation Facilities,Levy and Fees; and Tourism Development Fund have been prepared. This is expectedto promote tourism facilities and activities in <strong>Tanzania</strong> Mainland. In addition, theZanzibar Tourism Policy <strong>of</strong> 2004 and the Zanzibar Promotion Act <strong>of</strong> 1989 havebeen reviewed and submitted to the House <strong>of</strong> Representatives for approval.1.2.4 Tourism Developments• The government has started the process <strong>of</strong> listing the Central Slave TradeRoute by UNESCO as the World Heritage Site. The dossier was submitted toUNESCO in January 2009. This route passes through 14 districts <strong>of</strong> <strong>Tanzania</strong>Mainland. Management Plan for development <strong>of</strong> six sites namely, Bagamoyo,Mamboya, Kilimatinde, Mpwapwa, Ulyankulu and Ujiji is being prepared.• The government is collecting information on various camps and sites which wereused by the freedom fighters from South Africa, Zimbabwe, Mozambique andAngola with the aim <strong>of</strong> establishing heritage sites and promote them as touristattractions.• A plan to conserve the Kaole Ruins has been prepared and its implementationwill be done in partnership with the USA Embassy in <strong>Tanzania</strong>. The governmenthas also signed an agreement with the World Monument Fund <strong>of</strong> USA torestore the ruins <strong>of</strong> the Great Fort (gereza) <strong>of</strong> Kilwa Kisiwani.3
Kaole Ruins• The Aga Khan Trust for Culture completed the restoration <strong>of</strong> Forodhani Parkin Zanzibar’s Historic Stone Town in July 2009. The project has transformedthe World Heritage Site and upgraded social and recreational amenities in theHistorical Park.The New Forodhani Park• The expansion <strong>of</strong> the Zanzibar International Airport under the financing <strong>of</strong> theWorld <strong>Bank</strong> commenced in July 2009. The airport runway is expected to beextended from 2,462 meters to 3,022 meters.4
Chapter 2Analysis <strong>of</strong> Survey Results2.0 IntroductionThis chapter presents and analyses the results <strong>of</strong> the 2008 International Visitors’Exit Survey. This survey is the sixth in the series, after the maiden survey that wasconducted in 2001, followed by the 2004, 2005, 2006 and 2007 surveys. Like inthe previous years, the survey was administered at the country’s main boarder pointstargeting departing visitors. Through the questionnaire, important information onthe tourists’ pr<strong>of</strong>iles was collected. This included tourist source markets, age, gender,purpose <strong>of</strong> visits, travel arrangements and expenditure pattern.2.1 Source MarketsTable 2.1(a): Top 15 Source Markets to <strong>Tanzania</strong>S/N Country <strong>of</strong> Residance Visitors %<strong>of</strong> Total1 ITALY 962 15.12 UNITED STATES OF AMERICA 816 12.83 UNITED KINGDOM 601 9.44 SOUTH AFRICA 353 5.55 KENYA 315 4.96 GERMANY 312 4.97 FRANCE 234 3.78 CANADA 222 3.59 AUSTRALIA 207 3.210 NETHERLANDS 205 3.211 UNITED ARAB EMIRATES 195 3.112 ZAMBIA 155 2.413 NORWAY 147 2.314 SWEDEN 127 2.015 SWITZERLAND 127 2.016 OTHERS 1,410 22.1Total 6,388 100.05
Table 2.1(a) presents a total <strong>of</strong> 6,388 visitors who visited <strong>Tanzania</strong> from 106countries during the two weeks survey. As shown in the Table, Italy, the UnitedStates <strong>of</strong> America and the United Kingdom took the lead, accounting for about 37percent <strong>of</strong> all the visitors. Like in the previous surveys, Europe and North Americacontinued to be the prominent tourist source markets. The results also point out newdevelopments, whereby the United Arab Emirates (UAE) and Kenya were amongthe top fifteen source markets. The appearance <strong>of</strong> Kenya was also observed duringthe survey conducted in 2001. The increase in the visitors from Kenya can partlybe explained by the increasing trade relations between the two countries. On theother hand, the appearance <strong>of</strong> UAE in the top 15 source markets is partly associatedwith the introduction <strong>of</strong> daily direct flights by Emirates and Qatar Airways to thecountry.However, promotional efforts need to be enhanced in order to tap more visitors fromother markets like the Middle East as well as regional markets. It has been observedthat over-dependence on few traditional source markets (Europe and North America)is risky and might cause adverse effects in time <strong>of</strong> crises such as the recent GlobalFinancial Crisis.Table 2.1(b): Top 15 Source Markets to ZanzibarS/N COUNTRY OF RESIDENCE VISITORS % <strong>of</strong> Total1 ITALY 871 27.12 UNITED STATE OF AMERICA 325 10.13 SOUTH AFRICA 272 8.54 UNITED KINGDOM 250 7.85 GERMANY 180 5.66 FRANCE 109 3.47 UNITED ARAB EMIRATES 108 3.48. NETHERLANDS 103 3.29. NORWAY 102 3.210. AUSTRALIA 80 2.511 SWITZERLAND 78 2.412. SWEDEN 76 2.413. KENYA 73 2.314 CANADA 71 2.215. DENMARK 71 2.216. OTHERS 446 13.9Total 3,215 100.06
The major tourist attractions in Zanzibar are the sandy beaches and the historicalsites. As observed in the previous surveys, Italy continued to take the lead by bringingabout 27 percent <strong>of</strong> the visitors, followed by the United States <strong>of</strong> America (10 percent)and South Africa (9 percent) as shown in Table 2.1(b). The significance <strong>of</strong> the Italianmarket is largely associated with the existing Italian hotel establishments in Zanzibarcoupled with direct chartered flights from Italy. Likewise, the increase <strong>of</strong> the visitorsfrom South Africa is largely explained by the launching <strong>of</strong> ONE TIME AIR, whichflies directly from South Africa to the island three times a week. It is worth notingthat, the United Arab Emirates also appeared in the top fifteen source markets partlydue to the participation <strong>of</strong> Zanzibar in the Arab Travel Market (ATM), which takesplace in Dubai.2.2 Travel ArrangementChart 2.1: Travel ArrangementSurvey results depict that 56.2 percent <strong>of</strong> the all the visitors travelled under nonpackagetour and 43.8 percent came by the package tour arrangement (Chart 2.1).These results differ from the outcome <strong>of</strong> the previous surveys, where package tourhas been the most preferred travel arrangement. The change in the pattern <strong>of</strong> tourarrangement during this survey is partly explained by seasonality as the survey wasconducted during the mini-peak tourist season. It is worth mentioning that, most <strong>of</strong>the package tour visitors do not prefer to travel during the festive season (Christmasand New Year). The global financial crisis which started in the mid-2008 might havealso influenced the shift in the travel arrangement/pattern as it has been establishedthat during the time <strong>of</strong> crises, segments such as repeat visitors, special interest as wellas independent travellers and visiting friends and relatives, are assumed to be moreresilient 2 . This fact is evidenced by the increase in the proportion <strong>of</strong> tourists visitingfriends and relatives from 5.4 percent in 2007 to 15.3 percent in 2008 Survey.2UNWTO World Tourism Barometer, Vol. 7 No.1, January 2009.7
Table 2.2(a): Proportion <strong>of</strong> Visitors by Country <strong>of</strong> Residence and TravelArrangementTravel ArrangementSN COUNTRY OF RESIDENCE % <strong>of</strong> package % <strong>of</strong> non TotalPackage Visitor1. ITALY 13.2 1.8 9622. UNITED STATES OF AMERICA 4.4 8.4 8163. UNITED KINGDOM 3.1 6.4 6014. SOUTH AFRICA 3.7 1.8 3535. KENYA 0.8 4.1 3156. GERMANY 2.1 2.8 3127. FRANCE 2.0 1.7 2348 CANADA 2.4 1.1 2229. AUSTRALIA 2.2 1.1 20710. NETHERLANDS 1.7 1.5 20511. UNITED ARAB EMIRATES 1.1 1.9 19512. ZAMBIA 0.1 2.3 15513. NORWAY 0.3 2.0 14714. SWEDEN 0.6 1.4 12715. SWITZERLAND 0.8 1.2 12716. OTHERS 5.4 16.7 1,410TOTAL 43.8 56.2 6,388Table 2.2 (a) shows that the United States <strong>of</strong> America, United Kingdom, Kenya andGermany took the lead in bringing more visitors under the non package arrangement.On the other hand, Italy led by bringing more package visitors, largely due to theclose working relations between the Italian tour operators and investors, particularlyin Zanzibar.Table 2.2(b): Proportion <strong>of</strong> Visitors by Travel Arrangement and Purpose <strong>of</strong>visitPurpose <strong>of</strong> Visit by PercentageTravel arrangement Business conference Leasures and VFR OthersholidayPackage Tour 6.2 19.5 65.2 5.0 13.1Non -package Tour 93.8 80.5 34.8 95.0 86.9%<strong>of</strong> Total Vistors 100.0 100.0 100.0 100.0 100.08
Table 2.2 (b) indicates that the majority <strong>of</strong> the visitors that came for businesspurposes (93.8 percent), conference (80.5 percent) and Visiting Friends and Relatives(95.0 percent) were under the non-package tour arrangement. Conversely, most <strong>of</strong>holidaymakers (65.2 percent) were under the Package tour arrangement. A similarpattern <strong>of</strong> results was also obtained from the previous surveys conducted in 2001,2004 through 2007.Table 2.2(c): Purpose <strong>of</strong> Visit by Country under the Package Tour ArrangementCountry Business Conference Leisure and VFR OthersHolidayItaly 29.0 11.1 36.0 62.5 19.4Kenya 9.7 30.6 1.5 5.0 0.0Canada 9.7 0.0 2.7 0.0 11.1France 3.2 0.0 5.7 0.0 2.8Norway 0.0 0.0 0.7 0.0 13.9Sweden 0.0 0.0 1.7 0.0 5.6Zambia 3.2 0.0 0.1 2.5 0.0Germany 3.2 0.0 5.7 0.0 5.6Australia 0.0 0.0 6.2 0.0 5.6Netherlands 9.7 0.0 4.5 0.0 13.9Switzerland 0.0 16.7 2.0 0.0 0.0South Africa 3.2 0.0 10.5 7.5 0.0UnitedKingdom 12.9 25.0 7.9 10.0 5.6United Arab Emirates 0.0 0.0 3.1 7.5 0.0United States 16.1 16.7 11.8 5.0 16.7TOTAL(%) 100.0 100.0 100.0 100.0 100.0Table 2.2 (c) shows that Italy led in bringing more visitors for business, leisure andholidays as well as VFR. Meanwhile, Kenya brought more visitors for conferenceunder the package tour arrangement. Visitors from the United Kingdom who camefor business and conference were second in prominence.9
Table 2.2(d): Purpose <strong>of</strong> Visit by Country under the Non-package TourArrangementCountry Business Conference Leisure and Holidays VFR OtherItaly 2.9 2.2 5.9 4.6 2.9Kenya 10.8 26.5 5.6 14.7 6.1Canada 6.8 0.7 4.3 4.6 15.5France 5.3 4.4 4.7 3.3 1.4Norway 1.6 5.1 8.1 2.6 5.1Sweden 1.4 10.3 3.5 2.7 4.3Zambia 20.2 4.4 1.0 4.0 1.1Germany 5.7 8.8 8.0 7.5 3.2Australia 2.9 1.5 3.6 1.9 0.7Netherlands 3.1 2.2 4.6 3.7 2.5Switzerland 1.8 0.7 4.8 2.0 2.2South Africa 5.5 2.2 6.3 2.6 1.4United Kingdom 15.1 7.4 17.7 17.0 9.4United Arab Emirates 2.5 1.5 8.0 4.2 0.4United States 14.5 22.1 14.1 24.6 43.7TOTAL (%) 100.0 100.0 100.0 100.0 100.0Under the non-package tour arrangement, the majority <strong>of</strong> the visitors who camefor business were from Zambia, while those from Kenya dominated the conferencecategory [Table 2.2(d)]. The United Kingdom led in bringing more visitors forleisure and holidays followed by the United States <strong>of</strong> America. Under VisitingFriends and Relatives category, the United States took the lead.2.3 Age GroupTable 2.3: Number <strong>of</strong> Respondents by Age GroupAge Group (Years) Respondents % <strong>of</strong> TotalBelow 18 71 2.018-24 499 12.025-44 2,320 54.045-64 1,194 28.0Total 4,265 100.0Table 2.3 depicts the number <strong>of</strong> respondents by different age groups. About 54percent <strong>of</strong> the visitors who came to <strong>Tanzania</strong> were in the age group <strong>of</strong> 25-44,followed by the age group <strong>of</strong> 45-64. Very few visitors (about 4 percent) were in theage group <strong>of</strong> 65 years and above despite their potential in the market segmentation.10
This market segment is characterized by retired people who have ample time and anadequate income for leisure and holidays.Just like in the previous surveys, visitors in the age group <strong>of</strong> 25-44 continued todominate. These survey results are not surprising given the fact that this is an activeage group, mostly energetic and ready to take risks in exploring other parts <strong>of</strong> theworld. On the other hand, the small number <strong>of</strong> elderly visitors is partly explainedby inadequate facilities to carter for their requirements. Aging is the limiting factorwhen it comes to travel. It is therefore important to address the challenges associatedwith these visitors in order to increase tourism earnings. In view <strong>of</strong> this, the state<strong>of</strong> the physical infrastructure such as the airports and roads to the attraction sitesshould be improved.2.4 GenderChart 2.2: Visitors by GenderThe survey has recorded 6,388 visitors, out <strong>of</strong> which 3,328 were males accountingfor 52 percent <strong>of</strong> all the visitors (Chart 2.2). The remaining 48 percent were femalevisitors. There was a fair gender balance between men and women and the trend hasbeen consistent over the previous surveys.11
2.5 Visitors by Purpose <strong>of</strong> VisitChart 2.3: Visitors by Purpose <strong>of</strong> VisitChart 2.3 shows that about two-third <strong>of</strong> the visitors (62.4 percent) came intothe country for leisure and holiday, 15.3 percent for Visiting Friends and Relatives(VFR) and 11.9 percent for business purpose. The number <strong>of</strong> visitors who came forconference was minimal.Since the first comprehensive survey on the tourism sector which was conductedin 2001, it has been established that majority <strong>of</strong> the visitors came for leisure andholiday. The large number <strong>of</strong> holidaymakers is partly explained by the existence <strong>of</strong>unique tourist attractions; such as the National Parks, Ngorongoro Conservationarea, Mt. Kilimanjaro and Zanzibar Islands.12
Mt KilimanjaroHowever, the number <strong>of</strong> visitors who come for business and conference continueto be low despite the growing importance <strong>of</strong> Conference tourism worldwide. Inorder to address this problem, construction <strong>of</strong> a large and modern state-<strong>of</strong>-the-artconference auditorium to attract international Meetings, Incentives, Conferencesand Exhibitions (MICE) is necessary.Mnemba Island – Zanzibar13
Table 2.4: Interviewees by Purpose <strong>of</strong> Visit and Age GroupPurpose <strong>of</strong> Visit Age Group % <strong>of</strong> Total IntervieewsBUSINESS
This market segment (25 – 44) is very important in terms <strong>of</strong> value and uniquenessas it focuses on the special mix <strong>of</strong> activities at destination which includes study,work, volunteer placements and adventure (UNWTO, Barometer 2009). However,the results further suggest the need for intensifying promotional efforts to tap othermarket segments such as senior citizens.Table 2.5: Purpose <strong>of</strong> Visit by Country (in Percentage)COUNTRY/PURPOSEITALYUNITED STATES OF AMERICAUNITED KINGDOMSOUTH AFRICAKENYAGERMANYBusiness 2.5 9.7 13.5 8.2 18.4 9.6 12.0 17.1 7.2 9.3 6.7 67.1 5.4 5.5 7.1Conference 0.7 4.4 3.2 0.8 14.9 3.8 2.6 0.5 1.0 1.5 1.0 3.9 4.8 11.0 5.5Leisure and Holidays 89.3 49.1 58.4 83.9 28.3 66.3 73.5 46.8 83.6 70.7 75.4 8.4 64.6 57.5 71.7VFR 5.9 21.2 20.3 5.9 33.0 16.7 9.8 14.4 6.3 12.7 16.4 18.7 12.2 15.0 11.0Other 1.6 15.6 4.7 1.1 5.4 3.5 2.1 21.2 1.9 5.9 0.5 1.9 12.9 11.0 4.7Total (%) 100 100 100 100 100 100 100 100 100 100 100 100 100 100 100FRANCECANADAAUSTRALIANETHERLANDSUNITED ARAB EMIRATESZAMBIANORWAYSWEDENSWITZERLANDTable 2.5 shows that most <strong>of</strong> the visitors to <strong>Tanzania</strong> came for Leisure and holiday.Italy took a lead in this category by accounting for 89.3 percent <strong>of</strong> the total visitors,followed by South Africa (83.9 percent) and Australia (83.6 percent). On the otherhand, Kenya led in bringing tourists under VFR, followed by the United Statesand the United Kingdom. The prominence <strong>of</strong> Kenya under VFR is partly due tothe common languages, historical background and cultural ties; thus making theenvironment more familiar.Zambia recorded the highest number <strong>of</strong> visitors coming to <strong>Tanzania</strong> for business,followed by Kenya. The prominence <strong>of</strong> Zambia under the business category waslargely attributed to the inclusion <strong>of</strong> Tunduma boarder in the survey.15
2.6 Length <strong>of</strong> StayTable 2.6(a): Average Length <strong>of</strong> Stay <strong>of</strong> Visitors to <strong>Tanzania</strong>S/N CountryNon-Package Visitors’ Package Visitors’ AverageCountry Average Country Average1 ITALY 10 8 92 UNITED STATES OF AMERICA 10 11 103 UNITED KINGDOM 11 10 104 SOUTH AFRICA 7 7 75 KENYA 6 5 56 GERMANY 13 13 137 FRANCE 10 10 108 CANADA 11 13 129 AUSTRALIA 11 9 1010 NETHERLANDS 12 12 1211 UNITED ARAB EMIRATES 7 9 812 ZAMBIA 5 7 613 NORWAY 12 14 1314 SWEDEN 15 12 1315 SWITZERLAND 12 12 12Average 10 10 10The overall average length <strong>of</strong> stay for visitors to <strong>Tanzania</strong> was 10 nights (Table 2.6a).This is the lowest average length <strong>of</strong> stay recorded since inception <strong>of</strong> the survey in2001 largely due to seasonality as the survey was conducted in December (mini-peaktourist season). As indicated earlier, during such period most <strong>of</strong> the visitors comeunder the non-package arrangement and normally spend a few days at destination.Under the non-package arrangement, the visitors from Sweden recorded the highestaverage length <strong>of</strong> stay <strong>of</strong> 15 nights, followed by Germany with 13 nights. Just like inthe 2007 Survey, the country that stayed the least was Zambia, which recorded fivenights. Regarding the package tour arrangement, Norway had the highest averagelength <strong>of</strong> stay <strong>of</strong> 14 nights, followed by Canada and Germany, with 13 nights.Meanwhile, visitors from Kenya recorded the lowest average length <strong>of</strong> stay <strong>of</strong> fivedestinations nights. Results from the previous survey also showed that visitors fromlong haul tended to stay longer at destination. In view <strong>of</strong> this, it is important toensure that such markets are maintained by improving the infrastructure such as theroads and airports. On the other hand, the <strong>Tanzania</strong> Tourist Board should enhancepromotion in the emerging markets like India and China in case the traditionalsource markets face a calamity such as an economic crisis.16
Table 2.6(b): Average Length <strong>of</strong> Stay <strong>of</strong> Visitors to the <strong>Tanzania</strong> MainlandS/N Country Non-Package Package Visitors’ AverageVisitors’ Country Country AverageAverage1 UNITED STATES OF AMERICA 10 10 102 UNITED KINGDOM 10 8 93 GERMANY 10 10 104 KENYA 6 5 55 CANADA 10 11 116 AUSTRALIA 10 11 117 NETHERLANDS 11 9 108 FRANCE 9 8 89 ZAMBIA 5 6 510 UNITED ARAB EMIRATES 6 7 711 ITALY 9 7 812 NORWAY 9 10 1013 SWEDEN 13 6 914 SWITZERLAND 10 10 1015 SOUTH AFRICA 6 8 7Average 9 8 9Survey results in Table 2.6(b) indicate that the overall average length <strong>of</strong> stay forvisitors who toured <strong>Tanzania</strong> Mainland was nine nights with Canada and Australiarecording the highest average length <strong>of</strong> stay <strong>of</strong> 11 nights. As for the non-package tourarrangement, the highest average length <strong>of</strong> stay was 13 nights recorded by Sweden.Under the package tour arrangement, visitors from Canada and Australia led byrecording an average length <strong>of</strong> stay <strong>of</strong> 11 nights.17
Table 2.6 (c): Average Length <strong>of</strong> Stay to ZanzibarS/N Country <strong>of</strong> Residence Non-Package Visitors’ Package Visitors’ AverageCountry Average Country Average1 ITALY 9 8 82 UNITED STATES 8 5 73 SOUTH AFRICA 6 7 64 UNITED KINGDOM 6 6 65 GERMANY 7 8 86 FRANCE 6 7 67 UNITED ARAB EMIRATES 5 5 58 NETHERLANDS 5 6 59 NORWAY 16 5 1010 AUSTRALIA 7 3 511 SWITZERLAND 9 6 812 SWEDEN 9 9 913 KENYA 4 4 414 CANADA 5 4 515 DENMARK 9 7 8Average 7 8 7Table 2.6 (c) shows that the overall average length <strong>of</strong> stay was seven nights just likewhat was observed during the 2004, 2005 and 2007 surveys. The visitors fromNorway recorded the highest average length <strong>of</strong> stay <strong>of</strong> 10 nights followed by Sweden,with nine nights. Consistent with survey results obtained in 2007, Kenya which isclose to Zanzibar recorded the lowest overall average <strong>of</strong> five nights.Looking at the length <strong>of</strong> stay by travel arrangement, Norway stayed long by recording16 nights under the non-package tour arrangement. Visitors from Kenya recordedthe lowest average length <strong>of</strong> stay <strong>of</strong> four nights. On the other hand, visitors fromSweden recorded the highest average length <strong>of</strong> stay <strong>of</strong> nine nights under the packagetour arrangement. Visitors from Australia recorded the least average length <strong>of</strong> stay <strong>of</strong>three nights under the package tour arrangement.18
2.7 Average Length <strong>of</strong> Stay by Purpose <strong>of</strong> VisitTable 2.7 depicts survey results on the average length <strong>of</strong> stay for top 15 source marketsby purpose <strong>of</strong> visit. The results show that the average length <strong>of</strong> stay for visitors whocame for leisure and holidays was 10 nights. Those who came for Visiting Friendsand Relatives stayed for nine nights with Sweden taking the lead by recording 16nights, while Zambia had the lowest average length <strong>of</strong> stay <strong>of</strong> four nights. Visitorsfrom Canada and Sweden who came for conference recorded the highest averagelength <strong>of</strong> stay <strong>of</strong> 14 nights. Business visitors stayed for seven nights with Australiaand Netherlands taking the lead.Table 2.7: Average Length <strong>of</strong> Stay by Purpose <strong>of</strong> Visit for <strong>Tanzania</strong>S/N Country Business Conference Leisure VFR OtherandHolidays1 AUSTRALIA 15 1 10 13 232 CANADA 9 14 12 13 163 FRANCE 7 7 11 10 104 GERMANY 6 10 14 12 205 ITALY 7 9 9 8 96 KENYA 5 6 5 5 87 NETHERLANDS 11 8 13 14 148 NORWAY 5 11 12 13 179 SOUTH AFRICA 6 11 7 6 310 SWEDEN 7 14 13 16 2011 SWITZERLAND 5 8 13 10 1312 UNITED ARAB EMIRATES 6 8 7 6 N/A13 UNITED KINGDOM 7 6 11 8 2014 UNITED STATES 7 9 11 10 1015 ZAMBIA 6 8 6 4 5Average Total 7 8 10 9 13Generally, results that have been obtained from all the surveys showed that there isno improvement in the average length <strong>of</strong> stay <strong>of</strong> the visitors. One <strong>of</strong> the challengesfor tourism stakeholders is to increase the length <strong>of</strong> stay <strong>of</strong> visitors at destination.In order to increase the length <strong>of</strong> stay, there is a need to diversify tourism productsby incorporating cultural entertainments, historical sight seeing, shopping, amongothers. In addition, the infrastructure especially roads leading to the Southern TourismCircuit and the quality <strong>of</strong> services <strong>of</strong>fered to the tourists should be improved.19
Historical Sites2.8 Departure PointsThe Julius Nyerere International Airport (JNIA) is the main gateway <strong>of</strong> tourists to<strong>Tanzania</strong>. This is confirmed by information in Table 2.8 which indicates that majority<strong>of</strong> the visitors (46.3 percent) recorded during the survey departed through JNIA.Zanzibar Airport was the second leading departure point (26.2 percent) followedby Kilimanjaro International Airport (12.7 percent). Meanwhile, Namanga was theleading road boarder point.20
Table 2.8: The Number <strong>of</strong> Visitors by Departure PointsExit Point Visitors % <strong>of</strong> TotalJNIA 2,960 46.3ZAA 1,677 26.3KIA 810 12.7NAM 721 11.3TUN 220 3.4Total 6,388 100.0Survey results also show that visitors who came for leisure and holidays mostlydeparted through JNIA and Zanzibar Airport. Since the majority <strong>of</strong> these visitorswere from long haul destinations, they were compelled to use air transport. Thesame pattern <strong>of</strong> results was obtained during the previous surveys. The prominence<strong>of</strong> air as the major means <strong>of</strong> transport which is used by <strong>Tanzania</strong>n tourists calls forproper maintenance and upgrading <strong>of</strong> the airport facilities.2.9 Expenditure Analysis2.9.1 Total ExpenditureOne <strong>of</strong> the main objectives <strong>of</strong> this survey is to estimate the total tourist earning usingthe expenditure model developed in 2001. The variables used in the model includethe number <strong>of</strong> international visitor arrivals from the Immigration Department,average length <strong>of</strong> stay and average expenditure <strong>of</strong> both package and non packagevisitor per night. Using the model, it is estimated that in 2008, <strong>Tanzania</strong> earnedUSD 1,288,699,561, out <strong>of</strong> which Zanzibar earned USD 160,258,272. Theseearnings accrued from 770,376 and 98,677 international visitor arrivals to <strong>Tanzania</strong>and Zanzibar, respectively. The tourism earnings to Zanzibar were low in 2008compared to the previous year, largely due to the Global Financial Crisis which ledto a decline in international visitor arrivals. Chart 2.4 depicts tourism receipts inthe past five years.21
Chart 2.4: Tourism Receipts2.9.2 Average ExpenditureThe survey results show that the overall average expenditure for holiday visitors whocame under the package arrangement was USD 209 per night, while that <strong>of</strong> nonpackage was USD 186 per night (Table 2.9). The result indicates that overall, thepackage arrangement tours are more expensive than the non package trips due toconvenience during travel, safety and ease <strong>of</strong> reservation through travel agents.! "#!22
Table: 2.9: Average Holiday Visitor’s Expenditure per Night (Top 15 SourceMarkets)S/No Country Average Average NonPackage PackageExpenditure Expenditure(USD) (USD)1 FRANCE 334 2252 UNITED KINGDOM 301 1843 UNITED ARAB EMIRATES 325 2934 UNITED STATES OF AMERICA 270 1935 KENYA 266 2366 ZAMBIA 256 2817 SOUTH AFRICA 248 2528 SWEDEN 235 949 CANADA 232 15110 NETHERLANDS 210 10911 NORWAY 206 11112 GERMANY 202 11713 SWITZERLAND 185 15114 ITALY 125 14415 AUSTRALIA 121 153Average 209 186The survey results show that the highest average package expenditure per night perperson who came for holiday in <strong>Tanzania</strong> was recorded by visitors from France,followed by visitors from the United Arab Emirates. Visitors from Australia recordedthe least average expenditure under the package tour arrangement.On the other hand, non package visitors from the United Arab Emirates recordedthe highest average expenditure per night per person, followed by the visitors fromZambia. Sweden recorded the least average expenditure per night per person. Chart2.5 shows the trends <strong>of</strong> average expenditure by travel arrangement in the last fiveyears.23
Chart 2.5: Average Expenditure per Night <strong>of</strong> Holiday Makers2.9.3 Expenditure at DestinationIn order to provide the basis for construction <strong>of</strong> Tourism Satellite Account in <strong>Tanzania</strong>,the survey attempted to collect information on tourist expenditure in accommodation,food and drinks, transport, shopping and sightseeing. The expenditure <strong>of</strong> non-packagetourists was used. Given that payments were directly made by the respondents, itwas relatively easier to remember the incurred expenditure. As for tourists underpackage travel, most <strong>of</strong> the payments were pre-paid in wholesome amount at sourcemarkets, thus rendering difficulties in desegregating the expenditures by sector.Table 2.10: Percentage Distribution <strong>of</strong> Tourists’ Expenditure by CategoryItem Accommodation Food and Transport Shopping Sight Other TotalDrinksSeeingPercent (%) 28.0 23.0 11.0 14.0 11.0 14.0 100.0The survey results revealed that expenditure in accommodation accounted for 28percent, while food and drinks accounted for 23 percent (Table 2.10). The resultsindicate the importance <strong>of</strong> accommodation as well as food and drinks items in thetourism sector.24
2.10 Areas for ImprovementOthers,12.0%Too ManyTips Demanded,5%CreditCard Acceptabilityand Availability <strong>of</strong> ATMs,3.0%No Commentson Areas <strong>of</strong>Improvement15.0%Quality <strong>of</strong>Services, 11.0 %Chart 2.6: Visitors’ CommentsHigh Prices,5.0%Improveon Infrastructureand Other facilities,50.0%Chart 2.6 reveals that half <strong>of</strong> the respondents called upon the improvement <strong>of</strong>the infrastructure and other facilities. They were deeply concerned with the poorcondition <strong>of</strong> the roads leading to Tarangire and Serengeti as well as the traffic jamsto and from the Julius Nyerere International Airport. Similarly, visitors were notsatisfied with the conditions <strong>of</strong> the airports and their facilities such as air conditioners,signage and washrooms.Some <strong>of</strong> the visitors were not satisfied with the quality <strong>of</strong> the services providedduring their stay in <strong>Tanzania</strong>. Most <strong>of</strong> the visitors complained about poor and slowcustomer services and were dissatisfied with visa procedures.Most <strong>of</strong> these comments were also raised during the previous surveys and some<strong>of</strong> them are being addressed. For instance, in Zanzibar, the rehabilitation <strong>of</strong> therunaway at the airport has commenced and a shade has been installed at the checkingin area.25
Chapter 3Conclusion and Recommendations3.1 ConclusionThis report concludes the International Visitors’ Exit Survey that was conductedfor two weeks during the tourist mini-peak season. The survey had the followingobjectives:• To provide an up-to-date price information for estimating tourist expenditurein <strong>Tanzania</strong> in order to improve compilation <strong>of</strong> National Accounts and Balance<strong>of</strong> Payments statistics (BOP).• To collect information for tourism promotion and macro-economic policyformulation.The survey has been a success as it has met both objectives. Using the model thatwas developed in the 2001 International Visitors’ Exit Survey, and updated priceinformation obtained from the 2008 survey, it is estimated that <strong>Tanzania</strong> touristearnings for 2008 were USD 1,288,699,561. Out <strong>of</strong> this amount, Zanzibar’searnings were estimated to be USD 160,258,272.3.2. RecommendationsIn order to enhance the development <strong>of</strong> the tourism industry in <strong>Tanzania</strong>, thefollowing are the recommendations:1. Unsatisfactory State <strong>of</strong> Infrastructure and Other FacilitiesGiven that majority <strong>of</strong> the visitors who come to <strong>Tanzania</strong> use air transport;there is a need <strong>of</strong> improving airports and their facilities.Visitors also complained about poor conditions roads leading to Serengeti andTarangire National Parks. Therefore, there is a need to improve airports, roadsand other facilities such as air conditions, signage and washrooms.Responsible institutions: The Ministry <strong>of</strong> Infrastructure Development (MID),<strong>Tanzania</strong> Airports Authority (TAA) and Immigration Department (ID).26
2. Dominance <strong>of</strong> Visitors from Europe and North AmericaThe survey results continued to show the dominance <strong>of</strong> visitors from Europeand North America. In order to reduce the reliance on these two traditionalblocs, efforts should be made to penetrate into emerging source markets likethe Middle East as well as regional markets.Responsible institutions: The Ministry <strong>of</strong> Natural Resources and Tourism(MNRT), TTB, TCT, ZCT, Zanzibar Association <strong>of</strong> Tourism Investors (ZATI).3. Few Elderly Visitors (65 years and above)The survey results continue to reveal that a proportion <strong>of</strong> elderly visitorsremained minimal despite the fact that they are potential markets. As away to attract more elderly visitors, there is a need to upgrade standards inaccommodation establishments especially facilities to cater for elderly andpeople with disabilities.Responsible institutions: The Ministry <strong>of</strong> Natural Resources and Tourism(MNRT), TTB, TCT, ZCT, Zanzibar Association <strong>of</strong> Tourism Investors (ZATI).4. Low Number <strong>of</strong> Business and Conference VisitorsDespite the growing importance <strong>of</strong> the conference tourism in the world, thenumber <strong>of</strong> such visitors still remains low. There is a need to construct a largeand modern state-<strong>of</strong>-the-art conference auditorium to attract internationalMeetings, Incentives, Conferences and Exhibitions (MICE).Responsible institutions: Responsible institutions: MoFAIC, MNRT, TTB,TCT, ZCT, ZATI.5. Tourism Industry has been Negatively Impacted by the Global FinancialCrisis (GFC)In order to mitigate the effects <strong>of</strong> the Global Financial Crisis on the tourismsector, the following are recommended:• There is a need to closely monitor the tourism business trend throughcompilation and analysis <strong>of</strong> statistical data, information and consultingwith both the Public and Private Sectors,• Promote domestic and regional tourism. At the same time, targetindependent travelers who are more resilient at times <strong>of</strong> crisis. Tourismestablishments should also concentrate on containment <strong>of</strong> cost andimproving quality <strong>of</strong> products and services.Responsible institutions: MNRT, TTB, TCT, ZCT, ZATI27
~APPENDICES~28
Survey MethodologyAPPENDIX Ii. IntroductionThis chapter describes approach and methodological aspects involved inconducting the 2008 International Visitors` Exit Survey. It covers practicalissues related to the survey implementation. Mostly, it focuses on designing<strong>of</strong> the survey instruments, sampling framework and utilization <strong>of</strong> the tourists’expenditure model.ii. Scope <strong>of</strong> the SurveyThe target population for the survey was the departing international visitors. Aperson is considered as an international visitor if he/she travels to a country otherthan that <strong>of</strong> his/her usual residence, for a period not exceeding twelve months,and whose main purpose <strong>of</strong> visit is other than an activity remunerated fromwithin the country visited. All other travellers were considered outside the scope<strong>of</strong> the survey.iii. Sample SizeThe survey sample was planned to capture about two percent <strong>of</strong> 719,031international visitors who were recorded in 2007. This approach yields a samplesize <strong>of</strong> about 14,381 international visitors. In this regard, the survey managedto randomly interview about 4,265 respondents, who represented around 6,388visitors in the sample. In order to allow comparability across the years, the samplesize has remained consistent with the ones used during 2007 InternationalVisitors’ Exit Survey. This sample was considered sufficient to meet the survey’sobjectives.iv. Survey PeriodThe data collection exercise was undertaken during the mini-peak tourist season.The survey took two weeks, from 8th to 21st December, 2008.v. Survey CoverageIn order to obtain the required information from the international visitors, itwas important to conduct the survey at the entry/exit boarder points. The surveywas conducted in five departure points, namely: Julius Nyerere InternationalAirport (JNIA), Kilimanjaro International Airport (KIA), Zanzibar Airport(ZAA), Namanga (NAM) and Tunduma border points. These selected departurepoints are mostly used by the international visitors to <strong>Tanzania</strong>.29
vi. Enumerators’ ManualThe Technical Committee (TC) prepared the Enumerators’ Manual (EM) thatwas used by the enumerators as a reference document during the survey. Themanual contained information and guidelines on concepts and definitions <strong>of</strong>some <strong>of</strong> the key words used in the questionnaire. Additionally, the manualprovided the description <strong>of</strong> the questions and data cross-checking mechanism.vii.Training <strong>of</strong> EnumeratorsThe Enumerators’ Manual was used as a guideline document during the training.The purpose <strong>of</strong> the training was to guide the enumerators to understand thequestionnaire and equip them with interviewing techniques. Specifically, thetraining which was conducted by TC members aimed at providing skills andknowledge necessary for gathering information from the respondents.viii.The QuestionnaireThe questionnaire used in the survey had 13 questions (Appendix II):Questions 1 to 4 aimed at establishing the visitors’ pr<strong>of</strong>iles.Questions 5 to 8 targeted at obtaining the visitors’ travel behaviour namelytype <strong>of</strong> tour (package/non-package), items in the package and number <strong>of</strong> nightsspent.Questions 9 to 12 were structured to establish the tourists’ earnings ascribed to<strong>Tanzania</strong>. In addition, the questions probed for details on the amount <strong>of</strong> moneyspent in <strong>Tanzania</strong>.Question 13 aimed at obtaining the visitors’ perception <strong>of</strong> <strong>Tanzania</strong>’s tourismindustry.IX. Data ProcessingThe data processing exercise started with manual data editing followed by dataentry. The process further involved data cleaning in order to remove outliersfrom the database. The data was processed using the ORACLE8i RelationalDatabase Management System (RDMS), which was designed to cover all themajor information as captured in the questionnaire. The system also providesbasic reports as stipulated by the users.30
x. Tourist Expenditure EstimationTourist expenditure in the country was estimated using the Tourist ExpenditureModel that was developed during the comprehensive visitors’ exit surveyconducted in 2001. The model uses variables namely; average expenditure bytravel arrangement by purpose <strong>of</strong> visit, proportion <strong>of</strong> visitor by travel arrangement,average length <strong>of</strong> stay and number <strong>of</strong> tourist arrivals.The model is depicted in the following equation:Whereby:Ev = Total tourist expenditure in <strong>Tanzania</strong>;EP = Average package tour expenditure per visitor per night, derived from thesurvey;ENP = Average non-package tour expenditure per visitor per night, derived fromthe survey;VP = Number <strong>of</strong> arrivals under the package travel arrangement (The arrivals ascaptured by the Immigration Department, adjusted into package visitors bypurpose using survey results);VNP = Number <strong>of</strong> arrivals under the Non-package travel arrangement (The arrivalsas captured by the Immigration Department, proportionately adjusted intonon-package visitors using survey patterns);T = Average length <strong>of</strong> stay as computed from the survey.The Simplified ModelCountry <strong>of</strong>ResidencePurpose <strong>of</strong> VisitBusinessHolidayVFRTotal Visitors (sourcedfrom Immigration Dept)Visitors by travelPackage(VP )arrangementNonpackage(V NP )Avg. length <strong>of</strong>stayAvg. expenditure pervisitor per nightPackageNon PackageTotalexpenditure (EV)(T) (E P ) (E NP ) (E V)Procedure and Assumptions Used for the Estimation <strong>of</strong> Tourist Expenditurefor 2008;oCalculation <strong>of</strong> average package tour expenditure involved deduction <strong>of</strong> estimatedcost for international fare to <strong>Tanzania</strong> and commission accruing to a tourwholesaler. Information on the cost <strong>of</strong> international transport from the sourcemarkets was updated using the current information gathered from internationalcarriers that bring visitors to <strong>Tanzania</strong>.31
oooooThe average expenditure was computed after removing outliers from thedatabase. The cut-<strong>of</strong>f points were USD 10 and USD 1,500.About 10 percent <strong>of</strong> the value <strong>of</strong> the package is retained by the wholesaler tomeet overhead costs and commission.Immigration data on arrivals by purpose <strong>of</strong> visit were distributed according tothe package and non-package arrangements, using the travel arrangement ratiosas established in the survey.The survey results and total number <strong>of</strong> arrivals from Immigration Departmentwere used in the model in order to estimate annual tourists’ expenditure inthe country. Given the homogeneity nature <strong>of</strong> the visitors’ characteristic, theinformation collected during the survey is justifiable to represent the totalpopulation.The Immigration department provides a separate number <strong>of</strong> tourist arrivals forZanzibar that enabled the estimation <strong>of</strong> tourist expenditure for Zanzibar.32
APPENDIX IITHE 2008 INTERNATIONAL VISITORS’ EXIT <strong>SURVEY</strong>Please read the instructions carefully before filling the formINTRODUCTION:We hope that your stay in <strong>Tanzania</strong> was a pleasant one and a rewarding experience.Before you leave, we kindly ask you to complete this questionnaire as accuratelyas you can. The information you give will help us improve and develop ourtourism sector. The Ministry <strong>of</strong> Natural Resources and Tourism, National Bureau<strong>of</strong> Statistics, <strong>Bank</strong> <strong>of</strong> <strong>Tanzania</strong>, Immigration Department and the ZanzibarCommission for Tourism are jointly carrying out this survey.FOR OFFICIAL USE:CODE NUMBER:_________________________________________________NAME OF ENUMERATOR:________________________________________DATE:_____________________ SIGNATURE:_________________________NAME OF THE DATA ENTRANT:__________________________________33
1. Nationality ………….….……… Country <strong>of</strong> usual residence …………..….
10. Number <strong>of</strong> nights spent in:<strong>Tanzania</strong> MainlandZanzibar Islands11. How much money did you spend in <strong>Tanzania</strong> during this trip, includingcash, travellers cheque, and credit cards? (please give your best estimate incase you do not remember the exact figures)Currency……..........………..............12. Please give a breakdown <strong>of</strong> your expenditure in <strong>Tanzania</strong> on the following;Accommodation aloneCurrency .....………Food and drinksCurrency .....………Mountain ClimbingCurrency .....………DivingCurrency .......…….Access/entry/gate feesCurrency ......……..Visa fees and taxesCurrency ......……..ShoppingCurrency ......…..…Others (please specify): ………..… Currency ......…......13. What would you consider the most important areas that needimprovement?…………………………………………………………………………………………………………………………………………………………………………………………………………………………………………………………………………………………………………………………………………………………………………………………………………………………………………………………………………………………………………………………………………………………………………………………………………………………………………………………………………………………………………………………………………………………………………………………………………………………………………………………………………………………………………………………………………………………………………………………………………………………………………………………………………………………………………………………………………………………………………………………………………………………………………Thank you for your co-operation and for choosing <strong>Tanzania</strong> as your destination.Have a pleasant journey35
REFERENCESBOT, MNRT, NBS, IMMIGRATION DEPT, ZCT; <strong>Tanzania</strong> Tourism SectorSurvey Reports; 2001, 2004, 2005, 2006 and 2007United Nation World Tourism Organisation, World Tourism Barometer, 2009;Volume 7 No. 1, June 2009Websites;http://www.ilo.orghttp://www.weforum.orghttp://www.unwto.org36
Ministry <strong>of</strong> Natural Resources and Tourism (MNRT)www.mnrt.go.tz<strong>Bank</strong> <strong>of</strong> <strong>Tanzania</strong> (BOT)www.bot-tz.orgZanzibar Commission for Tourism (ZCT)www.zanzibartourism.netNational Bureau <strong>of</strong> Statistics (NBS)www.nbs.go.tzImmigration Departmentwww.moha.go.tz


