Intro to GIS Exercise #5 – Symbology and Map Layout / Design IUP ...
Intro to GIS Exercise #5 – Symbology and Map Layout / Design IUP ...
Intro to GIS Exercise #5 – Symbology and Map Layout / Design IUP ...

Create successful ePaper yourself
Turn your PDF publications into a flip-book with our unique Google optimized e-Paper software.
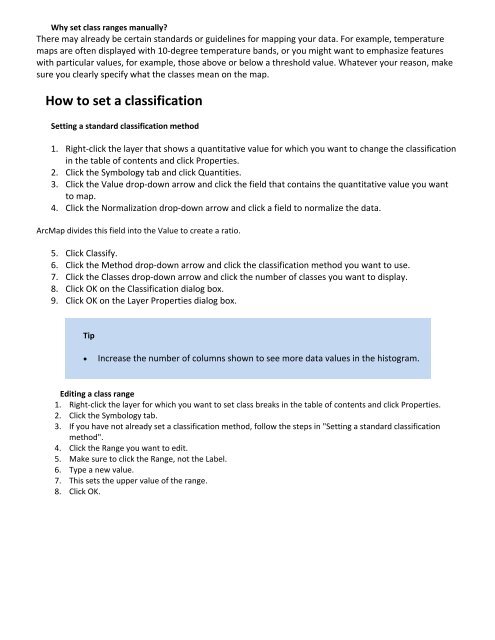
Why set class ranges manually?<br />
There may already be certain st<strong>and</strong>ards or guidelines for mapping your data. For example, temperature<br />
maps are often displayed with 10‐degree temperature b<strong>and</strong>s, or you might want <strong>to</strong> emphasize features<br />
with particular values, for example, those above or below a threshold value. Whatever your reason, make<br />
sure you clearly specify what the classes mean on the map.<br />
How <strong>to</strong> set a classification<br />
Setting a st<strong>and</strong>ard classification method<br />
1. Right‐click the layer that shows a quantitative value for which you want <strong>to</strong> change the classification<br />
in the table of contents <strong>and</strong> click Properties.<br />
2. Click the <strong>Symbology</strong> tab <strong>and</strong> click Quantities.<br />
3. Click the Value drop‐down arrow <strong>and</strong> click the field that contains the quantitative value you want<br />
<strong>to</strong> map.<br />
4. Click the Normalization drop‐down arrow <strong>and</strong> click a field <strong>to</strong> normalize the data.<br />
Arc<strong>Map</strong> divides this field in<strong>to</strong> the Value <strong>to</strong> create a ratio.<br />
5. Click Classify.<br />
6. Click the Method drop‐down arrow <strong>and</strong> click the classification method you want <strong>to</strong> use.<br />
7. Click the Classes drop‐down arrow <strong>and</strong> click the number of classes you want <strong>to</strong> display.<br />
8. Click OK on the Classification dialog box.<br />
9. Click OK on the Layer Properties dialog box.<br />
Tip<br />
� Increase the number of columns shown <strong>to</strong> see more data values in the his<strong>to</strong>gram.<br />
Editing a class range<br />
1. Right‐click the layer for which you want <strong>to</strong> set class breaks in the table of contents <strong>and</strong> click Properties.<br />
2. Click the <strong>Symbology</strong> tab.<br />
3. If you have not already set a classification method, follow the steps in "Setting a st<strong>and</strong>ard classification<br />
method".<br />
4. Click the Range you want <strong>to</strong> edit.<br />
5. Make sure <strong>to</strong> click the Range, not the Label.<br />
6. Type a new value.<br />
7. This sets the upper value of the range.<br />
8. Click OK.