Intro to GIS Exercise #5 – Symbology and Map Layout / Design IUP ...
Intro to GIS Exercise #5 – Symbology and Map Layout / Design IUP ...
Intro to GIS Exercise #5 – Symbology and Map Layout / Design IUP ...

You also want an ePaper? Increase the reach of your titles
YUMPU automatically turns print PDFs into web optimized ePapers that Google loves.
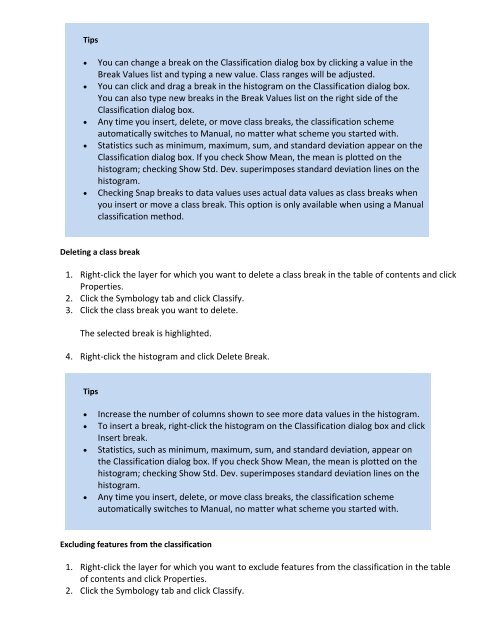
Tips<br />
� You can change a break on the Classification dialog box by clicking a value in the<br />
Break Values list <strong>and</strong> typing a new value. Class ranges will be adjusted.<br />
� You can click <strong>and</strong> drag a break in the his<strong>to</strong>gram on the Classification dialog box.<br />
You can also type new breaks in the Break Values list on the right side of the<br />
Classification dialog box.<br />
� Any time you insert, delete, or move class breaks, the classification scheme<br />
au<strong>to</strong>matically switches <strong>to</strong> Manual, no matter what scheme you started with.<br />
� Statistics such as minimum, maximum, sum, <strong>and</strong> st<strong>and</strong>ard deviation appear on the<br />
Classification dialog box. If you check Show Mean, the mean is plotted on the<br />
his<strong>to</strong>gram; checking Show Std. Dev. superimposes st<strong>and</strong>ard deviation lines on the<br />
his<strong>to</strong>gram.<br />
� Checking Snap breaks <strong>to</strong> data values uses actual data values as class breaks when<br />
you insert or move a class break. This option is only available when using a Manual<br />
classification method.<br />
Deleting a class break<br />
1. Right‐click the layer for which you want <strong>to</strong> delete a class break in the table of contents <strong>and</strong> click<br />
Properties.<br />
2. Click the <strong>Symbology</strong> tab <strong>and</strong> click Classify.<br />
3. Click the class break you want <strong>to</strong> delete.<br />
The selected break is highlighted.<br />
4. Right‐click the his<strong>to</strong>gram <strong>and</strong> click Delete Break.<br />
Tips<br />
� Increase the number of columns shown <strong>to</strong> see more data values in the his<strong>to</strong>gram.<br />
� To insert a break, right‐click the his<strong>to</strong>gram on the Classification dialog box <strong>and</strong> click<br />
Insert break.<br />
� Statistics, such as minimum, maximum, sum, <strong>and</strong> st<strong>and</strong>ard deviation, appear on<br />
the Classification dialog box. If you check Show Mean, the mean is plotted on the<br />
his<strong>to</strong>gram; checking Show Std. Dev. superimposes st<strong>and</strong>ard deviation lines on the<br />
his<strong>to</strong>gram.<br />
� Any time you insert, delete, or move class breaks, the classification scheme<br />
au<strong>to</strong>matically switches <strong>to</strong> Manual, no matter what scheme you started with.<br />
Excluding features from the classification<br />
1. Right‐click the layer for which you want <strong>to</strong> exclude features from the classification in the table<br />
of contents <strong>and</strong> click Properties.<br />
2. Click the <strong>Symbology</strong> tab <strong>and</strong> click Classify.