Intro to GIS Exercise #5 – Symbology and Map Layout / Design IUP ...
Intro to GIS Exercise #5 – Symbology and Map Layout / Design IUP ...
Intro to GIS Exercise #5 – Symbology and Map Layout / Design IUP ...

Create successful ePaper yourself
Turn your PDF publications into a flip-book with our unique Google optimized e-Paper software.
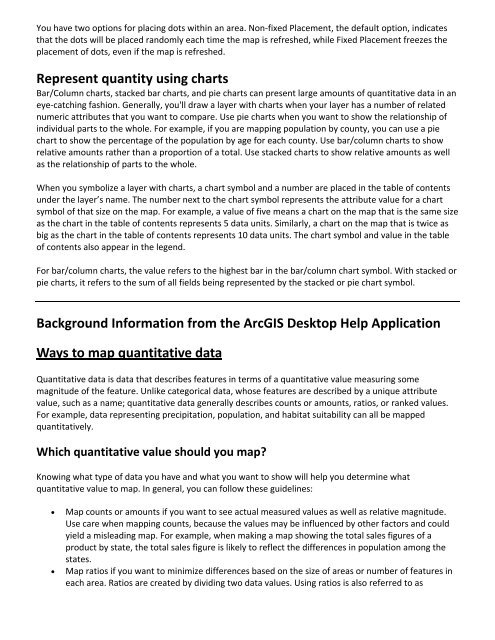
You have two options for placing dots within an area. Non‐fixed Placement, the default option, indicates<br />
that the dots will be placed r<strong>and</strong>omly each time the map is refreshed, while Fixed Placement freezes the<br />
placement of dots, even if the map is refreshed.<br />
Represent quantity using charts<br />
Bar/Column charts, stacked bar charts, <strong>and</strong> pie charts can present large amounts of quantitative data in an<br />
eye‐catching fashion. Generally, you'll draw a layer with charts when your layer has a number of related<br />
numeric attributes that you want <strong>to</strong> compare. Use pie charts when you want <strong>to</strong> show the relationship of<br />
individual parts <strong>to</strong> the whole. For example, if you are mapping population by county, you can use a pie<br />
chart <strong>to</strong> show the percentage of the population by age for each county. Use bar/column charts <strong>to</strong> show<br />
relative amounts rather than a proportion of a <strong>to</strong>tal. Use stacked charts <strong>to</strong> show relative amounts as well<br />
as the relationship of parts <strong>to</strong> the whole.<br />
When you symbolize a layer with charts, a chart symbol <strong>and</strong> a number are placed in the table of contents<br />
under the layer’s name. The number next <strong>to</strong> the chart symbol represents the attribute value for a chart<br />
symbol of that size on the map. For example, a value of five means a chart on the map that is the same size<br />
as the chart in the table of contents represents 5 data units. Similarly, a chart on the map that is twice as<br />
big as the chart in the table of contents represents 10 data units. The chart symbol <strong>and</strong> value in the table<br />
of contents also appear in the legend.<br />
For bar/column charts, the value refers <strong>to</strong> the highest bar in the bar/column chart symbol. With stacked or<br />
pie charts, it refers <strong>to</strong> the sum of all fields being represented by the stacked or pie chart symbol.<br />
Background Information from the Arc<strong>GIS</strong> Desk<strong>to</strong>p Help Application<br />
Ways <strong>to</strong> map quantitative data<br />
Quantitative data is data that describes features in terms of a quantitative value measuring some<br />
magnitude of the feature. Unlike categorical data, whose features are described by a unique attribute<br />
value, such as a name; quantitative data generally describes counts or amounts, ratios, or ranked values.<br />
For example, data representing precipitation, population, <strong>and</strong> habitat suitability can all be mapped<br />
quantitatively.<br />
Which quantitative value should you map?<br />
Knowing what type of data you have <strong>and</strong> what you want <strong>to</strong> show will help you determine what<br />
quantitative value <strong>to</strong> map. In general, you can follow these guidelines:<br />
� <strong>Map</strong> counts or amounts if you want <strong>to</strong> see actual measured values as well as relative magnitude.<br />
Use care when mapping counts, because the values may be influenced by other fac<strong>to</strong>rs <strong>and</strong> could<br />
yield a misleading map. For example, when making a map showing the <strong>to</strong>tal sales figures of a<br />
product by state, the <strong>to</strong>tal sales figure is likely <strong>to</strong> reflect the differences in population among the<br />
states.<br />
� <strong>Map</strong> ratios if you want <strong>to</strong> minimize differences based on the size of areas or number of features in<br />
each area. Ratios are created by dividing two data values. Using ratios is also referred <strong>to</strong> as