Intro to GIS Exercise #5 – Symbology and Map Layout / Design IUP ...
Intro to GIS Exercise #5 – Symbology and Map Layout / Design IUP ...
Intro to GIS Exercise #5 – Symbology and Map Layout / Design IUP ...

Create successful ePaper yourself
Turn your PDF publications into a flip-book with our unique Google optimized e-Paper software.
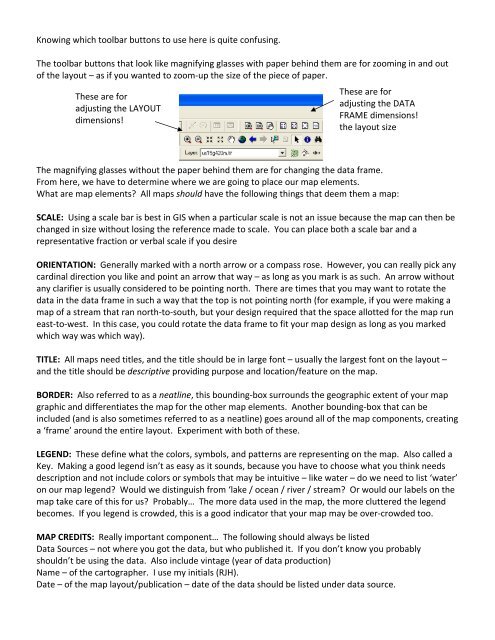
Knowing which <strong>to</strong>olbar but<strong>to</strong>ns <strong>to</strong> use here is quite confusing.<br />
The <strong>to</strong>olbar but<strong>to</strong>ns that look like magnifying glasses with paper behind them are for zooming in <strong>and</strong> out<br />
of the layout <strong>–</strong> as if you wanted <strong>to</strong> zoom‐up the size of the piece of paper.<br />
These are for<br />
adjusting the LAYOUT<br />
dimensions!<br />
These are for<br />
adjusting the DATA<br />
FRAME dimensions!<br />
the layout size<br />
The magnifying glasses without the paper behind them are for changing the data frame.<br />
From here, we have <strong>to</strong> determine where we are going <strong>to</strong> place our map elements.<br />
What are map elements? All maps should have the following things that deem them a map:<br />
SCALE: Using a scale bar is best in <strong>GIS</strong> when a particular scale is not an issue because the map can then be<br />
changed in size without losing the reference made <strong>to</strong> scale. You can place both a scale bar <strong>and</strong> a<br />
representative fraction or verbal scale if you desire<br />
ORIENTATION: Generally marked with a north arrow or a compass rose. However, you can really pick any<br />
cardinal direction you like <strong>and</strong> point an arrow that way <strong>–</strong> as long as you mark is as such. An arrow without<br />
any clarifier is usually considered <strong>to</strong> be pointing north. There are times that you may want <strong>to</strong> rotate the<br />
data in the data frame in such a way that the <strong>to</strong>p is not pointing north (for example, if you were making a<br />
map of a stream that ran north‐<strong>to</strong>‐south, but your design required that the space allotted for the map run<br />
east‐<strong>to</strong>‐west. In this case, you could rotate the data frame <strong>to</strong> fit your map design as long as you marked<br />
which way was which way).<br />
TITLE: All maps need titles, <strong>and</strong> the title should be in large font <strong>–</strong> usually the largest font on the layout <strong>–</strong><br />
<strong>and</strong> the title should be descriptive providing purpose <strong>and</strong> location/feature on the map.<br />
BORDER: Also referred <strong>to</strong> as a neatline, this bounding‐box surrounds the geographic extent of your map<br />
graphic <strong>and</strong> differentiates the map for the other map elements. Another bounding‐box that can be<br />
included (<strong>and</strong> is also sometimes referred <strong>to</strong> as a neatline) goes around all of the map components, creating<br />
a ‘frame’ around the entire layout. Experiment with both of these.<br />
LEGEND: These define what the colors, symbols, <strong>and</strong> patterns are representing on the map. Also called a<br />
Key. Making a good legend isn’t as easy as it sounds, because you have <strong>to</strong> choose what you think needs<br />
description <strong>and</strong> not include colors or symbols that may be intuitive <strong>–</strong> like water <strong>–</strong> do we need <strong>to</strong> list ‘water’<br />
on our map legend? Would we distinguish from ‘lake / ocean / river / stream? Or would our labels on the<br />
map take care of this for us? Probably… The more data used in the map, the more cluttered the legend<br />
becomes. If you legend is crowded, this is a good indica<strong>to</strong>r that your map may be over‐crowded <strong>to</strong>o.<br />
MAP CREDITS: Really important component… The following should always be listed<br />
Data Sources <strong>–</strong> not where you got the data, but who published it. If you don’t know you probably<br />
shouldn’t be using the data. Also include vintage (year of data production)<br />
Name <strong>–</strong> of the car<strong>to</strong>grapher. I use my initials (RJH).<br />
Date <strong>–</strong> of the map layout/publication <strong>–</strong> date of the data should be listed under data source.