Intro to GIS Exercise #5 – Symbology and Map Layout / Design IUP ...
Intro to GIS Exercise #5 – Symbology and Map Layout / Design IUP ...
Intro to GIS Exercise #5 – Symbology and Map Layout / Design IUP ...

Create successful ePaper yourself
Turn your PDF publications into a flip-book with our unique Google optimized e-Paper software.
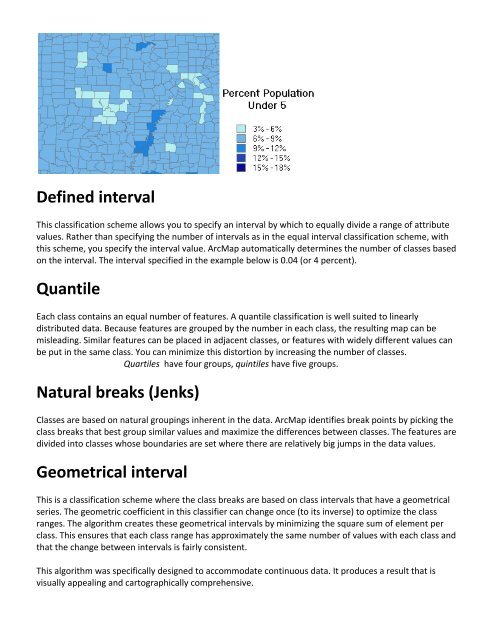
Defined interval<br />
This classification scheme allows you <strong>to</strong> specify an interval by which <strong>to</strong> equally divide a range of attribute<br />
values. Rather than specifying the number of intervals as in the equal interval classification scheme, with<br />
this scheme, you specify the interval value. Arc<strong>Map</strong> au<strong>to</strong>matically determines the number of classes based<br />
on the interval. The interval specified in the example below is 0.04 (or 4 percent).<br />
Quantile<br />
Each class contains an equal number of features. A quantile classification is well suited <strong>to</strong> linearly<br />
distributed data. Because features are grouped by the number in each class, the resulting map can be<br />
misleading. Similar features can be placed in adjacent classes, or features with widely different values can<br />
be put in the same class. You can minimize this dis<strong>to</strong>rtion by increasing the number of classes.<br />
Quartiles have four groups, quintiles have five groups.<br />
Natural breaks (Jenks)<br />
Classes are based on natural groupings inherent in the data. Arc<strong>Map</strong> identifies break points by picking the<br />
class breaks that best group similar values <strong>and</strong> maximize the differences between classes. The features are<br />
divided in<strong>to</strong> classes whose boundaries are set where there are relatively big jumps in the data values.<br />
Geometrical interval<br />
This is a classification scheme where the class breaks are based on class intervals that have a geometrical<br />
series. The geometric coefficient in this classifier can change once (<strong>to</strong> its inverse) <strong>to</strong> optimize the class<br />
ranges. The algorithm creates these geometrical intervals by minimizing the square sum of element per<br />
class. This ensures that each class range has approximately the same number of values with each class <strong>and</strong><br />
that the change between intervals is fairly consistent.<br />
This algorithm was specifically designed <strong>to</strong> accommodate continuous data. It produces a result that is<br />
visually appealing <strong>and</strong> car<strong>to</strong>graphically comprehensive.