Intro to GIS Exercise #5 – Symbology and Map Layout / Design IUP ...
Intro to GIS Exercise #5 – Symbology and Map Layout / Design IUP ...
Intro to GIS Exercise #5 – Symbology and Map Layout / Design IUP ...

Create successful ePaper yourself
Turn your PDF publications into a flip-book with our unique Google optimized e-Paper software.
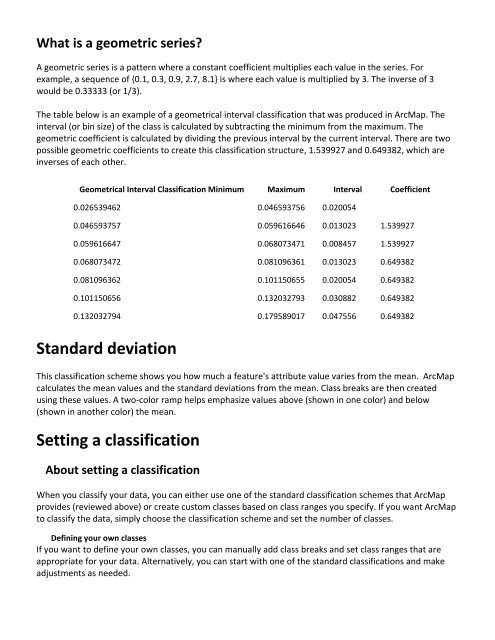
What is a geometric series?<br />
A geometric series is a pattern where a constant coefficient multiplies each value in the series. For<br />
example, a sequence of {0.1, 0.3, 0.9, 2.7, 8.1} is where each value is multiplied by 3. The inverse of 3<br />
would be 0.33333 (or 1/3).<br />
The table below is an example of a geometrical interval classification that was produced in Arc<strong>Map</strong>. The<br />
interval (or bin size) of the class is calculated by subtracting the minimum from the maximum. The<br />
geometric coefficient is calculated by dividing the previous interval by the current interval. There are two<br />
possible geometric coefficients <strong>to</strong> create this classification structure, 1.539927 <strong>and</strong> 0.649382, which are<br />
inverses of each other.<br />
Geometrical Interval Classification Minimum Maximum Interval Coefficient<br />
0.026539462 0.046593756 0.020054<br />
0.046593757 0.059616646 0.013023 1.539927<br />
0.059616647 0.068073471 0.008457 1.539927<br />
0.068073472 0.081096361 0.013023 0.649382<br />
0.081096362 0.101150655 0.020054 0.649382<br />
0.101150656 0.132032793 0.030882 0.649382<br />
0.132032794 0.179589017 0.047556 0.649382<br />
St<strong>and</strong>ard deviation<br />
This classification scheme shows you how much a feature's attribute value varies from the mean. Arc<strong>Map</strong><br />
calculates the mean values <strong>and</strong> the st<strong>and</strong>ard deviations from the mean. Class breaks are then created<br />
using these values. A two‐color ramp helps emphasize values above (shown in one color) <strong>and</strong> below<br />
(shown in another color) the mean.<br />
Setting a classification<br />
About setting a classification<br />
When you classify your data, you can either use one of the st<strong>and</strong>ard classification schemes that Arc<strong>Map</strong><br />
provides (reviewed above) or create cus<strong>to</strong>m classes based on class ranges you specify. If you want Arc<strong>Map</strong><br />
<strong>to</strong> classify the data, simply choose the classification scheme <strong>and</strong> set the number of classes.<br />
Defining your own classes<br />
If you want <strong>to</strong> define your own classes, you can manually add class breaks <strong>and</strong> set class ranges that are<br />
appropriate for your data. Alternatively, you can start with one of the st<strong>and</strong>ard classifications <strong>and</strong> make<br />
adjustments as needed.