Intro to GIS Exercise #5 – Symbology and Map Layout / Design IUP ...
Intro to GIS Exercise #5 – Symbology and Map Layout / Design IUP ...
Intro to GIS Exercise #5 – Symbology and Map Layout / Design IUP ...

You also want an ePaper? Increase the reach of your titles
YUMPU automatically turns print PDFs into web optimized ePapers that Google loves.
hierarchy, meaning use a washed‐out color <strong>to</strong> make the label almost disappear from initial view<br />
<strong>and</strong> that is most discernable upon closer inspection. You may also want <strong>to</strong> add more than 1 space<br />
between characters (wide‐spaced) in the label. This spacing, in combination with the dull coloring,<br />
produces a label that can cover a large area (such as a state) that is at the bot<strong>to</strong>m of the visual<br />
hierarchy (or put another way, that seams <strong>to</strong> be farther away from the viewer than other features<br />
in your design). Mountain ranges can be labeled with both splined text <strong>and</strong> wide‐spaced lettering.<br />
Another labeling technique that is almost always necessary <strong>to</strong> use is rotating the text label. Rotated text<br />
should be read from the bot<strong>to</strong>m up, meaning the beginning of the word should begin <strong>to</strong>wards the bot<strong>to</strong>m<br />
of the layout <strong>and</strong> extend <strong>to</strong>ward the <strong>to</strong>p of the design.<br />
Avoid crossing feature lines with text, meaning don’t place a label on a vec<strong>to</strong>r feature. If it is necessary <strong>to</strong><br />
do so, use the ‘halo’ effect in the label properties. The halo effect can also be used with point<br />
symbolization.<br />
Scale: The ratio scale value shows in the <strong>to</strong>p <strong>to</strong>ol bars of the data view. A good place <strong>to</strong> start when trying<br />
<strong>to</strong> determine the best scale <strong>to</strong> display your data in (unless there has been a scale determined in the scope<br />
of work phase) is <strong>to</strong> right‐click on the data feature you are interested in <strong>and</strong> scroll down <strong>to</strong> ‘zoom <strong>to</strong> layer’.<br />
Let’s zoom <strong>to</strong> the TLCW_dissolve feature. The scale <strong>to</strong> which the data frame zooms <strong>to</strong> depends on the<br />
size of your data frame in Arc<strong>Map</strong>… <strong>and</strong> the size of the data frame depends on several things, like: the size<br />
of your hardware display (i.e., moni<strong>to</strong>r) / do you have lots of <strong>to</strong>ol windows open either <strong>to</strong> the <strong>to</strong>p (on the<br />
<strong>to</strong>olbar) or on the sides (i.e., ArcToolbox) /do you have the Arc<strong>Map</strong> program maximized <strong>to</strong> display in all of<br />
the area available on your moni<strong>to</strong>r (maximize by clicking the square between the line (minimize) <strong>and</strong> the<br />
red ‘X’ (close) at the <strong>to</strong>p right of the window (as is done on all Microsoft Windows applications).<br />
The zoom <strong>to</strong> layer comm<strong>and</strong> will fit the entire feature in the available space allotted <strong>to</strong> the data frame.<br />
Most often this is some odd number. The scale will also change when you switch from the data view <strong>to</strong><br />
the layout view <strong>–</strong> this is due <strong>to</strong> the different dimensions of the data frame.<br />
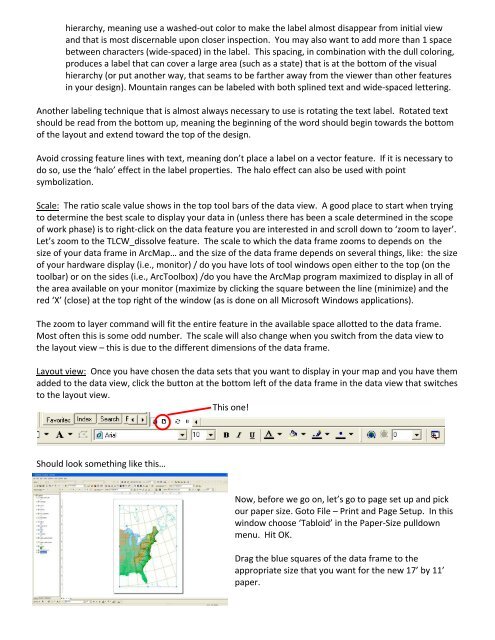
<strong>Layout</strong> view: Once you have chosen the data sets that you want <strong>to</strong> display in your map <strong>and</strong> you have them<br />
added <strong>to</strong> the data view, click the but<strong>to</strong>n at the bot<strong>to</strong>m left of the data frame in the data view that switches<br />
<strong>to</strong> the layout view.<br />
This one!<br />
Should look something like this…<br />
Now, before we go on, let’s go <strong>to</strong> page set up <strong>and</strong> pick<br />
our paper size. Go<strong>to</strong> File <strong>–</strong> Print <strong>and</strong> Page Setup. In this<br />
window choose ‘Tabloid’ in the Paper‐Size pulldown<br />
menu. Hit OK.<br />
Drag the blue squares of the data frame <strong>to</strong> the<br />
appropriate size that you want for the new 17’ by 11’<br />
paper.