
Create successful ePaper yourself
Turn your PDF publications into a flip-book with our unique Google optimized e-Paper software.
Welcome to our 2011 Financial Analysts’ Conference<br />
. . . . . . . . . . . . . . . . . . . . . . . . .<br />
. . . . . . . . . . . . . . . . . . . . . . . . .<br />
. . . . . . . . . . . . . . . . . . . . . . . . .<br />
Erwin Stoller, Executive Chairman
Disclaimer<br />
These materials do not constitute, or form a part of, an invitation or an offer to purchase, sell, trade or subscribe for any securities, and<br />
neither these materials (including any portion hereof) nor any distribution of these materials (including any portion hereof) shall form the<br />
basis of, or be relied in connection with, any contract or investment decision in relation to any securities.<br />
These materials do not constitute an offering prospectus within the meaning of Article 652a of the Swiss Code of Obligations, a listing<br />
prospectus as defined in the listing rules of the SIX Swiss Exchange Ltd or a prospectus under any other legislative or regulatory<br />
provisions of any jurisdiction.<br />
These materials contain forward-looking statements concerning the Company and its business and the industry in which it operates that<br />
express intentions and expectations relating to future financial, operational and other developments and results. Such forward-looking<br />
statements are based on the currently held beliefs and assumptions of the management of the Company that are expressed in good<br />
faith and that management believes to be reasonable. Forward-looking statements involve known and unknown risks, uncertainties and<br />
other factors that could cause the actual results, financial condition, performance, or achievements of the Company, its business or the<br />
industry in which it operates to differ materially from the results, financial condition, performance or achievements expressed or implied<br />
by such forward-looking statements. Given these risks, uncertainties and other factors, recipients of these materials are cautioned not<br />
to place undue reliance on these forward-looking statements. Each such forward-looking statement speaks only as of the date of the<br />
particular statement, and the Company undertakes no obligation to publicly update or revise any such statement, except as required by<br />
law.<br />
You should not assume that the information contained in these materials is accurate as of any date other than the date on the cover.<br />
Changes to the information contained in these materials may occur after that date, and the Company undertakes no obligation to<br />
update the information, except in the normal course of its public disclosure obligations and practices.<br />
THESE MATERIALS ARE STRICTLY CONFIDENTIAL AND MUST NOT BE DISCLOSED OR DISTRIBUTED TO THIRD PARTIES.<br />
DISTRIBUTION OF THESE MATERIALS MAY BE RESTRICTED BY LAW IN CERTAIN JURISDICTIONS. PERSONS IN<br />
POSSESSION OF THESE MATERIALS ARE REQUIRED TO INFORM THEMSELVES ABOUT AND OBSERVE SUCH<br />
RESTRICTIONS. ANY FAILURE TO COMPLY WITH THESE RESTRICTIONS MAY CONSTITUTE A VIOLATION OF THE<br />
SECURITIES LAWS OF ANY SUCH JURISDICTIONS. THE COMPANY DOES NOT ACCEPT ANY RESPONSIBILITY FOR ANY<br />
VIOLATION BY ANY PERSON OF ANY SUCH RESTRICTIONS.<br />
THESE MATERIALS NOT CONSTITUTE AN OFFER TO SELL OR THE SOLICITATION OF AN OFFER TO BUY ANY SECURITY.<br />
© 2011, <strong>Rieter</strong> Holding Ltd., All rights reserved
2010 Full Year Results and<br />
Separation of Automotive Systems division<br />
. . . . . . . . . . . . . . . . . . . . . . . . .<br />
. . . . . . . . . . . . . . . . . . . . . . . . .<br />
. Erwin . . Stoller, . Executive . . Chairman . . . . . . . . . . . . . . . . . . .<br />
Urs Leinhäuser, Chief Financial Officer
Agenda<br />
. . . . .<br />
. . . . .<br />
. . . . .<br />
. . . . .<br />
. . . . .<br />
. . . . .<br />
. . . . .<br />
. . . . .<br />
. . . . .<br />
FAK/BMK 2010 March 2011<br />
<strong>Autoneum</strong><br />
1. Introduction Erwin Stoller<br />
2. Review of business year 2010 Urs Leinhäuser<br />
3. Separation of Textile Systems and Erwin Stoller/<br />
Automotive Systems Urs Leinhäuser<br />
4. Introducing the focused Automotive Business Erwin Stoller<br />
(<strong>Autoneum</strong>)<br />
5. Introducing the focused Textile business (<strong>Rieter</strong>) Erwin Stoller<br />
6. Summary: Steps for a successful future Erwin Stoller<br />
7. Outlook Erwin Stoller<br />
8. Q & A<br />
9. Appendix<br />
4
Introduction<br />
• Successful turnaround<br />
• Striking increase in volumes and return to profits<br />
• Changes in the Group Executive Committee<br />
FAK/BMK 2010 March 2011<br />
<strong>Autoneum</strong><br />
5
Introduction: Successful Turnaround<br />
FAK/BMK 2010 March 2011<br />
<strong>Autoneum</strong><br />
• Breakeven lowered successfully due to restructuring program started in<br />
2008<br />
• Successful launch of new products developed in 2008/2009<br />
• Further strengthening of footprint in growth markets China/India<br />
(market position, volumes, plants, employees)<br />
6
Introduction: Striking increase in volumes and return to<br />
profit<br />
FAK/BMK 2010 March 2011<br />
<strong>Autoneum</strong><br />
• Volume increase Textile Systems due to the fast recovery of textile<br />
machinery and components markets<br />
• Automotive Systems volume increased due to high growth in all regions<br />
• Volume increase in both divisions transformed into increased operating<br />
result and profit<br />
7
Introduction: Changes in Group Executive Committee <strong>Autoneum</strong><br />
• The Board of Directors has appointed Martin Hirzel as the new head of<br />
the <strong>Rieter</strong> Automotive Systems division and as a member of the Group<br />
Executive Committee.<br />
• He will assume his position as of mid-April succeding Wolfgang Drees,<br />
who is resigning at his own request. Martin Hirzel has headed the SAMEA<br />
Business Group of Automotive Systems since 2007 and has clearly<br />
improved the profitability of SAMEA in this period.<br />
• From 1997 to 2007 he had various management positions at both<br />
divisions in Switzerland and China.<br />
• Wolfgang Drees has been with <strong>Rieter</strong> since 2007, most recently as head<br />
of Automotive Systems and member of the Group Executive Committee.<br />
He carried out extensive restructuring programs, launched major new<br />
products and successfully completed the turnaround. The Board regrets<br />
the departure of Wolfgang Drees and wishes to thank him for his<br />
important contribution he has made to <strong>Rieter</strong> during the difficult crisis<br />
years.<br />
FAK/BMK 2010 March 2011<br />
8
Agenda<br />
. . . . .<br />
. . . . .<br />
. . . . .<br />
. . . . .<br />
. . . . .<br />
. . . . .<br />
. . . . .<br />
. . . . .<br />
. . . . .<br />
FAK/BMK 2010 March 2011<br />
<strong>Autoneum</strong><br />
1. Introduction Erwin Stoller<br />
2. Review of business year 2010 Urs Leinhäuser<br />
3. Separation of Textile Systems and Erwin Stoller/<br />
Automotive Systems Urs Leinhäuser<br />
4. Introducing the focused Automotive Business Erwin Stoller<br />
(<strong>Autoneum</strong>)<br />
5. Introducing the focused Textile business (<strong>Rieter</strong>) Erwin Stoller<br />
6. Summary: Steps for a successful future Erwin Stoller<br />
7. Outlook Erwin Stoller<br />
8. Q & A<br />
9. Appendix<br />
9
<strong>Rieter</strong> Group: Financial key figures 2010<br />
Change FY09 vs. FY10<br />
• Sales: +32%<br />
• Orders received: +64%<br />
FAK/BMK 2010 March 2011<br />
<strong>Autoneum</strong><br />
• Operating result: 98.0 million CHF (2009: -186.6 million CHF)<br />
• Net result: 41.6 million CHF (2009: -217.5 million CHF)<br />
• Net liquidity: -3.5 million CHF (2009: 10.4 million CHF)<br />
Sales 2007 vs. 2010: -34%<br />
10
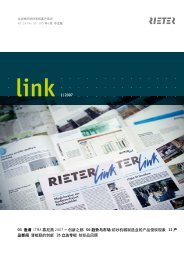
<strong>Rieter</strong> Group: 2010 orders received<br />
million CHF<br />
3'500<br />
3'000<br />
2'500<br />
2'000<br />
1'500<br />
1'000<br />
500<br />
0<br />
FAK/BMK 2010 March 2011<br />
1'935<br />
64%<br />
3'170<br />
2009 2010<br />
<strong>Autoneum</strong><br />
• Striking increase in 2010<br />
orders received<br />
• Orders received by the<br />
<strong>Rieter</strong> Group were 64%<br />
higher (68% in local<br />
currencies)<br />
• The trend in order intake<br />
was dynamic throughout the<br />
year<br />
• Steep rise vs. 2009 primarily<br />
due to strong demand at<br />
Textile Systems<br />
11
<strong>Rieter</strong> Group: Sales per half-year<br />
million CHF<br />
1'500<br />
1'250<br />
1'000<br />
750<br />
500<br />
250<br />
0<br />
900<br />
FAK/BMK 2010 March 2011<br />
2009: 1’956 2010: 2’586<br />
32%<br />
1'056<br />
HY1 HY2<br />
1'201<br />
1'385<br />
HY1 HY2<br />
2009 2010<br />
<strong>Autoneum</strong><br />
• 32% increase in sales in<br />
2010 (36% in local<br />
currencies)<br />
• Positive sales development<br />
during the last four<br />
semesters<br />
• Sales in HY2 2010 15%<br />
higher than in HY1 2010<br />
12
<strong>Rieter</strong> Group: Sales by geographical region<br />
million CHF<br />
1'200<br />
1'000<br />
800<br />
600<br />
400<br />
200<br />
0<br />
936<br />
15%<br />
1'079<br />
FAK/BMK 2010 March 2011<br />
405<br />
74%<br />
704<br />
433<br />
35%<br />
584<br />
182<br />
219<br />
Europe + Africa Asia North America Latin America<br />
2009 2010<br />
20%<br />
<strong>Autoneum</strong><br />
• With worldwide presence<br />
further strengthened in Asia<br />
• Double-digit sales growth in<br />
all regions<br />
• Strongest sales growth in<br />
Asia (74%) due primarily to<br />
Textile Systems<br />
• Exchange rate trends<br />
(Euro/Dollar) adversely<br />
impacted sales in CHF<br />
13
<strong>Rieter</strong> Group: EBIT, per half-year<br />
million CHF 2009: -187 2010: 98<br />
150<br />
100<br />
50<br />
0<br />
-50<br />
-100<br />
-150<br />
-200<br />
1) in % of CO<br />
-137<br />
FAK/BMK 2010 March 2011<br />
-50<br />
HY1 HY2<br />
285<br />
15<br />
2009 2010<br />
83<br />
6.3% 1)<br />
HY1 HY2<br />
<strong>Autoneum</strong><br />
• Continuous improvement of<br />
operating result during the<br />
last four semesters<br />
• Operating result was<br />
increased by 285 million<br />
CHF in 2010 vs. 2009<br />
• Substantial improvement<br />
due largely to good capacity<br />
utilization and favorable cost<br />
structure with lowered breakeven<br />
point<br />
14
<strong>Rieter</strong> Group: Net result<br />
million CHF 2009 2010<br />
Operating result before<br />
interest and taxes (EBIT)<br />
FAK/BMK 2010 March 2011<br />
-186.6 98.0<br />
in % of Corporate output -10.1 3.9<br />
Financial result<br />
Net result<br />
before taxes<br />
Taxes<br />
Net result<br />
-24.9<br />
-211.5<br />
-6.0<br />
-217.5<br />
-31.2<br />
66.8<br />
-25.2<br />
41.6<br />
<strong>Autoneum</strong><br />
• The 259.1 million CHF<br />
increase in the net result<br />
was due to improved<br />
operating result<br />
• Following two years of<br />
losses <strong>Rieter</strong> posted a net<br />
profit of 41.6 million CHF<br />
• Financial result was<br />
negatively impacted by<br />
currency fluctuations and<br />
one-time charges for<br />
refinancing (250 million CHF<br />
bond issue in March 2010)<br />
and interest on bond<br />
15
<strong>Rieter</strong> Group: Net result per half-year<br />
million CHF 2009: -218 2010: 42<br />
100<br />
50<br />
0<br />
-50<br />
-100<br />
-150<br />
1) in % of CO<br />
-146<br />
FAK/BMK 2010 March 2011<br />
-72<br />
HY1 HY2<br />
260<br />
-15<br />
57<br />
HY1 HY2<br />
2009 2010<br />
4.3% 1)<br />
<strong>Autoneum</strong><br />
• Steady improvement of net<br />
profit during the last four<br />
semesters<br />
• Return to profitability<br />
achieved in HY 2010<br />
• Marked improvement vs.<br />
previous year due to<br />
improved operating result<br />
• Improvements continued<br />
also in HY2 2010<br />
16
<strong>Rieter</strong> Group: Net working capital<br />
million CHF 2009 2010<br />
Inventories<br />
FAK/BMK 2010 March 2011<br />
266.0 328.4<br />
Trade receivables 331.5 381.5<br />
Other receivables<br />
Trade payables -226.8 -315.8<br />
Advance payments by customers -63.3 -110.9<br />
Other current liabilities -387.3 -291.4<br />
Net working capital<br />
99.4<br />
19.5<br />
98.0<br />
89.8<br />
<strong>Autoneum</strong><br />
• Net working capital<br />
increased by 70.3 million<br />
CHF<br />
• Increase of inventories by<br />
62.4 million CHF due to<br />
volume increase in both<br />
divisions<br />
• Inventory level compared to<br />
corporate output decreased<br />
from 14.4% in 2009 to 13.0%<br />
in 2010 due to effective<br />
inventory management<br />
• Payment conditions<br />
remained stable<br />
• Advance payments<br />
increased with order intake<br />
• Current liabilities significantly<br />
reduced by pay-outs for<br />
restructuring<br />
17
<strong>Rieter</strong> Group: Balance sheet<br />
million CHF 2009 2010<br />
Total assets<br />
FAK/BMK 2010 March 2011<br />
1’814.1 1’969.1<br />
Non-current assets 886.5 802.2<br />
Net working capital<br />
Cash and cash equivalents 217.7 351.9<br />
Marketable securities 13.0 7.1<br />
Financial debt<br />
long-term<br />
short-term<br />
Shareholders’ equity<br />
In % of total assets<br />
19.5<br />
222.4<br />
140.7<br />
81.7<br />
655.8<br />
36.2<br />
89.8<br />
362.5<br />
296.3<br />
66.2<br />
627.6<br />
31.9<br />
<strong>Autoneum</strong><br />
• Sound balance sheet<br />
• High amount of cash and<br />
cash equivalents per yearend<br />
(increase of 134.2<br />
million CHF vs. previous<br />
year) due to bond issue<br />
• Financial debt rose by 140.1<br />
million CHF to 362.5 million<br />
CHF due to bond issue of<br />
250 million CHF<br />
• Net liquidity of -3.5 million<br />
CHF only slightly negative<br />
• Equity ratio was 32% (36%<br />
in previous year); currency<br />
translation impact on equity<br />
of -62.3 million CHF in 2010<br />
18
<strong>Rieter</strong> Group: Free cash flow<br />
million CHF 2009 2010<br />
Net result<br />
FAK/BMK 2010 March 2011<br />
-217.5 41.6<br />
Cash flow -93.0 170.3<br />
Net cash flow<br />
Change in net working capital 141.7 -81.8<br />
Capital expenditure, net -45.4 -92.1<br />
Investments in financial assets, net -4.3 0.1<br />
Change in securities<br />
Divestments<br />
Free cash flow<br />
-143.3<br />
-5.6<br />
22.1<br />
-34.8<br />
187.9<br />
4.7<br />
-5.2<br />
13.6<br />
<strong>Autoneum</strong><br />
• Positive free cash flow<br />
achieved in 2010 of 13.6<br />
million CHF<br />
• Cash flow improved by<br />
263.3 million CHF in 2010<br />
vs. 2009<br />
• Net working capital increase<br />
and capital expenditures<br />
completely financed by cash<br />
generated from operations<br />
• Capex substantially lower<br />
than depreciation<br />
19
Textile Systems 2010<br />
A leading supplier of short-staple fiber machinery and components<br />
FAK/BMK 2010 March 2011<br />
<strong>Autoneum</strong><br />
20
Textile Systems: Order intake<br />
million CHF<br />
2008: 539 2009: 511<br />
800<br />
600<br />
400<br />
200<br />
0<br />
417<br />
122<br />
HY1 HY2<br />
2008<br />
FAK/BMK 2010 March 2011<br />
-5% 185%<br />
190<br />
321<br />
HY1 HY2<br />
2009<br />
2010: 1’455<br />
739<br />
716<br />
HY1 HY2<br />
2010<br />
<strong>Autoneum</strong><br />
• Positive dynamic in order<br />
intake throughout the year<br />
• Most important countries for<br />
<strong>Rieter</strong> were China, India and<br />
Turkey.<br />
• Large volume of demand<br />
also from Bangladesh,<br />
Brazil, Indonesia, South<br />
Korea, the USA, and<br />
Uzbekistan<br />
• Both machinery and<br />
components business<br />
showed strong increase in<br />
order intake<br />
21
Textile Systems: Sales<br />
million CHF<br />
2008: 1’120 2009: 532<br />
800<br />
600<br />
400<br />
200<br />
0<br />
665<br />
455<br />
HY1 HY2<br />
2008<br />
FAK/BMK 2010 March 2011<br />
-53% 64%<br />
250<br />
282<br />
HY1 HY2<br />
2009<br />
2010: 870<br />
325<br />
545<br />
HY1 HY2<br />
2010<br />
<strong>Autoneum</strong><br />
• Sales growth was especially<br />
strong in HY2, in the year as<br />
a whole sales rose by 64%<br />
• Highest sales in Asia<br />
• Sales development also<br />
positively impacted by<br />
launch of new machines for<br />
Asian markets<br />
22
Textile Systems: EBIT<br />
million CHF<br />
1)<br />
2008: -50 2009: -74<br />
80<br />
40<br />
0<br />
-40<br />
-80<br />
-120<br />
55<br />
FAK/BMK 2010 March 2011<br />
-105<br />
HY1 HY2<br />
2008<br />
1) 2008 including special charges<br />
-24 152<br />
-58<br />
-16<br />
HY1 HY2<br />
2009<br />
2010: 78<br />
2<br />
2010<br />
76<br />
HY1 HY2<br />
<strong>Autoneum</strong><br />
• Positive operating result<br />
achieved in HY2 2010 of 76<br />
million CHF<br />
• Increase in operating result<br />
by 152 million CHF vs. 2009<br />
was mainly due to<br />
– Significant volume<br />
increase and higher<br />
capacity utilization<br />
– Lowered break-even<br />
point achieved by<br />
restructuring programm<br />
initiated in 2008<br />
– Continued cost<br />
awareness<br />
23
Automotive Systems 2010<br />
FAK/BMK 2010 March 2011<br />
<strong>Autoneum</strong><br />
One of the global technology leaders in acoustic and thermal management<br />
solutions for motor vehicles<br />
24
Automotive Systems: Sales<br />
million CHF<br />
2'500<br />
2'000<br />
1'500<br />
1'000<br />
500<br />
0<br />
2'022<br />
FAK/BMK 2010 March 2011<br />
-30% 20%<br />
1'424<br />
1'715<br />
2008 2009 2010<br />
<strong>Autoneum</strong><br />
• 2010 sales increased by<br />
20% - sales growth in all<br />
regions<br />
• Weak US Dollar and Euro<br />
vs. CHF had an adverse<br />
impact on 2010 sales<br />
reported in CHF, growth in<br />
local currencies is 25%<br />
• Only slightly lower 2010<br />
sales in HY2 vs. HY1,<br />
despite seasonal effects<br />
• Broadly diversified customer<br />
portfolio, <strong>Rieter</strong> supplies all<br />
leading car manufacturers<br />
worldwide<br />
25
Automotive Systems: EBIT<br />
million CHF<br />
50<br />
0<br />
-50<br />
-100<br />
-150<br />
-200<br />
-250<br />
-300<br />
-251<br />
FAK/BMK 2010 March 2011<br />
146<br />
-105<br />
136<br />
2008 2009 2010<br />
31<br />
<strong>Autoneum</strong><br />
• Positive operating result<br />
achieved in 2010 of 31<br />
million CHF<br />
• Increase in 2010 operating<br />
result by 136 million CHF vs.<br />
2009 was mainly due to<br />
–Cost reductions<br />
achieved by<br />
restructuring program<br />
initiated in 2008<br />
–Volume increase and<br />
higher capacity<br />
utilization<br />
–Ongoing measures to<br />
improve efficiency and<br />
productivity<br />
–Continued cost<br />
awareness<br />
26
Agenda<br />
. . . . .<br />
. . . . .<br />
. . . . .<br />
. . . . .<br />
. . . . .<br />
. . . . .<br />
. . . . .<br />
. . . . .<br />
. . . . .<br />
FAK/BMK 2010 March 2011<br />
<strong>Autoneum</strong><br />
1. Introduction Erwin Stoller<br />
2. Review of business year 2010 Urs Leinhäuser<br />
3. Separation of Textile Systems and Erwin Stoller/<br />
Automotive Systems Urs Leinhäuser<br />
4. Introducing the focused Automotive Business Erwin Stoller<br />
(<strong>Autoneum</strong>)<br />
5. Introducing the focused Textile business (<strong>Rieter</strong>) Erwin Stoller<br />
6. Summary: Steps for a successful future Erwin Stoller<br />
7. Outlook Erwin Stoller<br />
8. Q & A<br />
9. Appendix<br />
27
Starting point for strategy evaluation<br />
FAK/BMK 2010 March 2011<br />
<strong>Autoneum</strong><br />
• Following the successful joint development under one roof for decades,<br />
both divisions are now globally structured, individually sustainable and<br />
ready to be positioned as strong and focused standalone entities on the<br />
capital markets<br />
• Today, both divisions are operated as separate businesses with their own<br />
management teams and organizations.<br />
• Board of Directors made a thorough evaluation of the divisional strategies<br />
in HY1 2010 and of the Group strategy in HY2 2010<br />
• Result of strategy evaluation: Separation as best solution<br />
• Making them fully independent in the context of the proposed transaction<br />
is therefore a logical step<br />
28
What we want to achieve<br />
Increased focus<br />
• Split of the group into two pure-play listed entities<br />
Enhanced strategic flexibility<br />
FAK/BMK 2010 March 2011<br />
Transaction Rationale<br />
<strong>Autoneum</strong><br />
• Strengthening of individual investment cases by seizing further development potential and<br />
growth opportunities<br />
Separation as ultimate step of transformation<br />
• Consequence of long-run corporate development<br />
Accelerating individual development<br />
29
Separation of Automotive division from <strong>Rieter</strong> Group<br />
Split of the group into two pure-play entities<br />
FAK/BMK 2010 March 2011<br />
<strong>Autoneum</strong><br />
• Successful joint development under one roof has enabled development of <strong>Rieter</strong> Textile<br />
Systems (in future <strong>Rieter</strong>) and <strong>Rieter</strong> Automotive Systems (in future <strong>Autoneum</strong>) to be<br />
positioned as strong and focused standalone entities which are now individually<br />
sustainable<br />
• Increased transparency and visibility offers clear value proposition to existing and new<br />
shareholders<br />
• <strong>Rieter</strong> and <strong>Autoneum</strong> will continue to be trusted partners for customers, suppliers and<br />
employees<br />
• Increased management focus<br />
Increased focus<br />
30
Separation of <strong>Autoneum</strong> from <strong>Rieter</strong> Group<br />
FAK/BMK 2010 March 2011<br />
Enhanced strategic flexibility<br />
Strengthening of individual investment cases by seizing further<br />
development potential and growth opportunities<br />
• Crystallises the businesses’ inherent values<br />
<strong>Autoneum</strong><br />
• <strong>Rieter</strong> – A leading supplier of short-staple fiber spinning machinery and components<br />
• <strong>Autoneum</strong> – One of the global technology leaders for integrated acoustic and thermal<br />
management<br />
• Separated entities will enjoy more flexibility to enter partnerships and co-operations<br />
• Higher flexibility to manage capital structure in-line with specific business model<br />
31
Separation of <strong>Autoneum</strong> from <strong>Rieter</strong> Group<br />
FAK/BMK 2010 March 2011<br />
Separation as ultimate step of transformation<br />
Consequence of long-run corporate development<br />
• <strong>Rieter</strong> and <strong>Autoneum</strong> already operated as separate businesses<br />
<strong>Autoneum</strong><br />
• Separation requires minimal organisational changes and does not cause dis-synergies<br />
• Current business characteristics offer limited diversification effect<br />
• Each entity set-up to sustain cycles individually<br />
32
Separation process<br />
Textile<br />
Systems<br />
FAK/BMK 2010 March 2011<br />
Shareholders<br />
<strong>Autoneum</strong><br />
Current <strong>Rieter</strong> Group structure Structure post separation<br />
SIX listed<br />
100%<br />
Distribution of<br />
<strong>Autoneum</strong> to <strong>Rieter</strong><br />
shareholders<br />
100% 100%<br />
Automotive<br />
Systems<br />
(“<strong>Autoneum</strong><br />
Holding AG”)<br />
Shareholders<br />
SIX listed SIX listed<br />
<strong>Rieter</strong><br />
(Textile<br />
Business)<br />
<strong>Autoneum</strong><br />
<strong>Autoneum</strong><br />
(Automotive<br />
Business)<br />
33
Transaction structure and expected timetable<br />
• Distribution of <strong>Autoneum</strong> to shareholders by way of a special dividend<br />
• 1 new <strong>Autoneum</strong> share for each <strong>Rieter</strong> share<br />
• AGM approval required<br />
FAK/BMK 2010 March 2011<br />
Transaction structure<br />
• Two largest shareholders support the transaction<br />
Expected timetable<br />
• <strong>Rieter</strong> Holding’s share register closed March 31 - April, 13<br />
• Annual General Meeting of <strong>Rieter</strong> Holding April, 13<br />
• Publication of listing prospectus (<strong>Autoneum</strong> shares) May, 2<br />
<strong>Autoneum</strong><br />
• Cut-off date for entitlement to receive <strong>Autoneum</strong> shares May, 12 (after close of trading on SIX)<br />
• Date of listing of <strong>Autoneum</strong> shares on the SIX May, 13<br />
• First Trading Day for <strong>Autoneum</strong> shares on the SIX May, 13<br />
• First trading day of <strong>Rieter</strong> Holding Shares trade ex- May, 13<br />
dividend right<br />
34
Role of largest shareholders<br />
Commitment of largest shareholders<br />
FAK/BMK 2010 March 2011<br />
<strong>Autoneum</strong><br />
The two largest shareholders of <strong>Rieter</strong> Holding, Peter Spuhler and Michael Pieper, support the<br />
proposed transaction and have confirmed that they will vote all their <strong>Rieter</strong> Holding Shares in<br />
favor of the Separation at the 2011 AGM<br />
• Both shareholders have entered into a lock-up agreement pursuant to which they have<br />
agreed:<br />
– not to sell or otherwise dispose of any <strong>Autoneum</strong> Shares during the 6-month period after<br />
the First Trading Day, and<br />
– to each maintain the stake in <strong>Autoneum</strong> equal to or greater than 10% of <strong>Autoneum</strong>’s<br />
share capital for the 30-month period thereafter<br />
• Additionally both shareholders will each provide a subordinated loan to <strong>Autoneum</strong> in the<br />
amount of CHF 12,500,000<br />
• Peter Spuhler and Michael Pieper have also agreed to remain on the Board of Directors<br />
until at least <strong>Autoneum</strong>’s 2014 Annual General Meeting<br />
35
Agenda<br />
. . . . .<br />
. . . . .<br />
. . . . .<br />
. . . . .<br />
. . . . .<br />
. . . . .<br />
. . . . .<br />
. . . . .<br />
. . . . .<br />
FAK/BMK 2010 March 2011<br />
<strong>Autoneum</strong><br />
1. Introduction Erwin Stoller<br />
2. Review of business year 2010 Urs Leinhäuser<br />
3. Separation of Textile Systems and Erwin Stoller/<br />
Automotive Systems Urs Leinhäuser<br />
4. Introducing the focused Automotive Business Erwin Stoller<br />
(<strong>Autoneum</strong>)<br />
5. Introducing the focused Textile business (<strong>Rieter</strong>) Erwin Stoller<br />
6. Summary: Steps for a successful future Erwin Stoller<br />
7. Outlook Erwin Stoller<br />
8. Q & A<br />
36
Key investment highlights<br />
1<br />
Provider of integrated<br />
solutions<br />
2<br />
FAK/BMK 2010 March 2011<br />
Technology leadership<br />
3<br />
Broad OEM portfolio<br />
and global footprint<br />
4<br />
Leading market<br />
positions<br />
5<br />
Attractive market<br />
fundamentals<br />
6<br />
<strong>Autoneum</strong><br />
Successful restructuring<br />
to provide upside<br />
37
Provider of integrated solutions<br />
Combination of core competences<br />
Design and measurement expertise<br />
Best-in-class acoustics<br />
FAK/BMK 2010 March 2011<br />
Product excellence<br />
Acoustics & thermal management<br />
<strong>Autoneum</strong><br />
38
Technology & product leadership<br />
Interior<br />
Floor<br />
Interior<br />
Floor<br />
Under-body<br />
Under-body<br />
Engine Bay<br />
Trunk<br />
FAK/BMK 2010 March 2011<br />
Product family<br />
Tufted Carpets<br />
Inner<br />
Dash<br />
Acoustic Heat<br />
Shield<br />
Heat Shield<br />
Engine Bay<br />
Cover<br />
Trunkside Trim<br />
Recent innovations<br />
<strong>Rieter</strong> Pure Tuft<br />
Hybrid acoustics<br />
RIMIC<br />
Triform Pattern<br />
Rie-BAY Panel<br />
RUS Trunkside Trim<br />
Key benefits<br />
<strong>Autoneum</strong><br />
• Innovative backing resulting in lower<br />
weight as compared to <strong>Autoneum</strong>’s<br />
existing carpet generation<br />
• Tunable acoustic performance and up<br />
to 50% weight saving<br />
• Customized noise<br />
absorption & frequency levels<br />
• New pattern with 15-20% less weight<br />
compared to conventional embossing<br />
patterns<br />
• Innovative concept for vehicle<br />
mounted engine encapsulation<br />
• Less weight, better fuel efficiency<br />
• Top acoustic performance<br />
• Lightweight & stiff: glass-free &<br />
recyclable mono-material<br />
39
Global footprint and diversified customer base<br />
Global footprint<br />
FAK/BMK 2010 March 2011<br />
Manufacturing facilities<br />
Development centers<br />
Acoustic centers<br />
Research & Technology Center (CH)<br />
� Global manufacturing setup with 48 state-of-the-art production facilities<br />
� Global network of 7 development centers worldwide and one central<br />
research and technology center in Switzerland<br />
Source: Public company information, <strong>Autoneum</strong> internal estimates<br />
(1) Based on 2010 <strong>Autoneum</strong> total sales<br />
(2) Passenger cars and light commercial vehicles weighting less than six tons<br />
(3) Medium and heavy commercial vehicles weighting over six tons<br />
(1, 2)<br />
Top 10 OEMs (light vehicles)<br />
Others<br />
(13% of 2010 sales)<br />
Trucks (3)<br />
(8% of 2010 sales)<br />
5%<br />
5%<br />
<strong>Autoneum</strong><br />
7%<br />
7%<br />
6%<br />
8%<br />
8%<br />
Global Trucks Trucks<br />
10%<br />
10%<br />
13%<br />
40
Business groups 2010<br />
FAK/BMK 2010 March 2011<br />
<strong>Autoneum</strong><br />
Business Groups Europe North America Asia SAMEA<br />
Key Financials 2010<br />
Net sales (1) (CHFm) 897 549 77 150<br />
% y-o-y growth 13% 36% 48% 17%<br />
EBITDA (CHFm) 20 58 9 13<br />
% margin 2% 10% 12% 9%<br />
Operational<br />
Manufacturing<br />
facilities (2) 24 10 7 7<br />
Employees (3) 3,732 2,286 895 1,195<br />
Top 3 OEMs 2010<br />
(by 2010 net sales)<br />
(1) Third party sales, including inter segment sales reduced by sales deductions<br />
(2) Including those operated through its joint ventures in which <strong>Autoneum</strong> has a controlling interest<br />
(3) Full time equivalent employees at year end 2010, excluding apprentices and temporary employees, including those employed by its joint ventures in which <strong>Autoneum</strong> has a controlling interest<br />
Trucks<br />
41
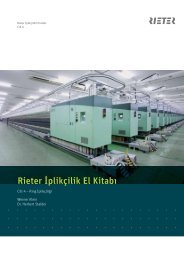
Strong automotive market recovery<br />
Estimated light vehicle production in million units<br />
70.4 m units in 2007<br />
59.5 m units in 2009<br />
74.1 m units in 2010<br />
88.8 m units in 2013<br />
15.0<br />
8.6<br />
FAK/BMK 2010 March 2011<br />
11.9<br />
North America (3)<br />
7.1% (1)<br />
14.6<br />
Growth rate (1)<br />
+6.2%<br />
3.6 3.7 4.1 5.0<br />
South America<br />
7.0% (1)<br />
16.2<br />
12.0<br />
13.5 15.1<br />
Western Europe<br />
3.7% (1)<br />
1.8 1.8 2.0 2.4<br />
ROW<br />
6.2% (1)<br />
Source: IHS Global Insights as of March 2011<br />
(1) CAGR (2010-2013)<br />
(2) Includes Belarus, Bulgaria, Czech Republic, Hungary, Kazakhstan, Lithuania, Poland, Romania, Serbia, Slovakia, Slovenia, Ukraine and Uzbekistan<br />
(3) Including USA, Canada and Mexico<br />
3.5 3.3 3.5 3.9<br />
Eastern Europe (2)<br />
3.6% (1)<br />
1.9 2.4 3.2<br />
India<br />
15.8% (1)<br />
4.9<br />
7.9<br />
<strong>Autoneum</strong><br />
12.7<br />
China<br />
11.2<br />
6.7 5.7<br />
16.6<br />
8.5% (1)<br />
7.8<br />
7.5<br />
Rest of Asia<br />
6.2% (1)<br />
Japan<br />
0.3% (1)<br />
21.3<br />
9.4 9.5<br />
8.9<br />
42
Upside from restructuring program<br />
Cornerstone of 2008 restructuring program<br />
1 • Move manufacturing capacity from<br />
Western to Eastern Europe<br />
2 • Optimize manufacturing capacities in<br />
North America<br />
3 • Simplification of the organization,<br />
reduction of overhead costs, selective<br />
disposals of non-core activities<br />
(1) Excludes goodwill impairment and write-offs of approx. CHF 49 MM<br />
FAK/BMK 2010 March 2011<br />
<strong>Autoneum</strong><br />
4 • Significantly lower break-even target<br />
achieved<br />
5 • Majority of projects accomplished in<br />
2010 and to bring full savings in 2012<br />
6 • Completion of 2008 Restructuring<br />
Program with total cost of CHF 195<br />
MM (1) by 2012<br />
43
Strategic priorities<br />
1<br />
2<br />
3<br />
4<br />
Continuous<br />
performance<br />
improvement<br />
Optimize<br />
production<br />
footprint<br />
Enhance<br />
position in<br />
growing<br />
markets<br />
Maintain<br />
product- and<br />
technologyleadership<br />
FAK/BMK 2010 March 2011<br />
<strong>Autoneum</strong><br />
• Strong focus on cost reduction with continuous improvement (MOVE) and special projects<br />
• Further spread <strong>Rieter</strong> Production System (RPS) as manufacturing standard<br />
• Successfully launch new manufacturing facilities in China, India and Eastern Europe<br />
• Additional footprint adjustments in Europe due to move to Eastern Europe<br />
• Maintain flexibility with low break-even point<br />
• Establish strong position in growing markets especially in Asia (currently with focus on<br />
global expansion with existing customers)<br />
• Maintain and further develop JVs to access selected OEMs and regional markets<br />
• Maintain innovation leadership by focusing on selected innovation projects for leveraging<br />
„cost down – value up“ strategy<br />
• Technological partner of choice for leading OEMs<br />
44
Overview of <strong>Autoneum</strong>‘s Board of Directors and<br />
Group Executive Board<br />
CFO and<br />
Deputy CEO<br />
Urs Leinhäuser<br />
FAK/BMK 2010 March 2011<br />
Board of Directors<br />
Hans-Peter Schwald, Chairman<br />
Rainer Schmückle, Michael Pieper,<br />
This E. Schneider, Peter Spuhler, Ferdinand Stutz<br />
Business Group<br />
Europe<br />
Charles Fäh<br />
CEO<br />
Martin Hirzel<br />
Business Group<br />
North America<br />
Richard Derr<br />
Business Group<br />
Asia<br />
Uwe Trautmann<br />
<strong>Autoneum</strong><br />
Business Group<br />
SAMEA<br />
Martin Hirzel<br />
45
Mid-term financial targets<br />
Net sales<br />
Profitability /<br />
Return on net<br />
assets<br />
Capital<br />
expenditure<br />
Indebtness<br />
Dividend<br />
payout<br />
FAK/BMK 2010 March 2011<br />
• Annual growth of 4% - 5% (excluding currency effects)<br />
• Flat to moderate growth in Western Europe<br />
• Moderate growth in North America<br />
• Strong growth in Asia<br />
<strong>Autoneum</strong><br />
• Return on Net Assets > Cost of Capital<br />
• Main improvement driven by operational leverage in Europe with target<br />
mid-term EBITDA margin of 7–8% in the region conditional to further footprint<br />
adjustments<br />
• Sustainable double digit EBITDA margins in North America, SAMEA and Asia<br />
• Average long term capex of 4.0%-4.5% of net sales<br />
• Continue to maintain long-term conservative leverage below 1.5x net debt /<br />
EBITDA and 30% equity ratio<br />
• Target payout-ratio of up to 30%<br />
46
Agenda<br />
. . . . .<br />
. . . . .<br />
. . . . .<br />
. . . . .<br />
. . . . .<br />
. . . . .<br />
. . . . .<br />
. . . . .<br />
. . . . .<br />
FAK/BMK 2010 March 2011<br />
<strong>Autoneum</strong><br />
1. Introduction Erwin Stoller<br />
2. Review of business year 2010 Urs Leinhäuser<br />
3. Separation of Textile Systems and Erwin Stoller/<br />
Automotive Systems Urs Leinhäuser<br />
4. Introducing the focused Automotive Business Erwin Stoller<br />
(<strong>Autoneum</strong>)<br />
5. Introducing the focused Textile business (<strong>Rieter</strong>) Erwin Stoller<br />
6. Summary: Steps for a successful future Erwin Stoller<br />
7. Outlook Erwin Stoller<br />
8. Q & A<br />
47
Key investment highlights of <strong>Rieter</strong><br />
5<br />
6<br />
FAK/BMK 2010 March 2011<br />
Experienced<br />
Management team<br />
and Board of<br />
Directors<br />
Efficient cycle<br />
management<br />
1<br />
4<br />
Long-term growth<br />
industry<br />
<strong>Rieter</strong><br />
Technology and<br />
innovation<br />
leadership<br />
2<br />
3<br />
<strong>Autoneum</strong><br />
Broadest global<br />
systems supplier<br />
Leading market<br />
positions<br />
48
Long-term growth industry<br />
FAK/BMK 2010 March 2011<br />
<strong>Autoneum</strong><br />
Textile business will keep on growing – <strong>Rieter</strong> participates in the biggest<br />
segment of short staple fibers<br />
2<br />
1900 1950 2002 2016<br />
World population (billion)<br />
Short staple, including staple filaments<br />
Per-capita consumption (kg/p)<br />
Non-wovens<br />
World fiber consumption (million t)<br />
Non-spun<br />
Filaments<br />
Long staple<br />
Source: PCI<br />
2<br />
3<br />
World population and fiber consumption growth<br />
3<br />
3<br />
9<br />
6<br />
9<br />
57<br />
7<br />
13<br />
92<br />
49
Broadest global systems supplier<br />
Legend<br />
Sales<br />
Service<br />
R&D<br />
Production<br />
Americas<br />
FAK/BMK 2010 March 2011<br />
<strong>Autoneum</strong><br />
Global supplier… …of spinning machinery and components<br />
Europe<br />
Full-liner…<br />
From bale… …to yarn<br />
Asia<br />
Preparation<br />
[Pic] [Pic]<br />
…covering preparation and<br />
all four spinning technologies<br />
High/import segment<br />
Mid/local segment<br />
Ring conventional (1)<br />
Ring compact (2)<br />
Rotor (3)<br />
Air-Jet (4)<br />
50
Efficient cycle management<br />
1'600<br />
1'400<br />
1'200<br />
1'000<br />
800<br />
600<br />
400<br />
200<br />
0<br />
749<br />
567<br />
FAK/BMK 2010 March 2011<br />
794<br />
Sales 2) 1998 – 2010, million CHF<br />
957<br />
898<br />
935 932<br />
879<br />
1'211<br />
1'440<br />
<strong>Autoneum</strong><br />
-24% +40% +21% -6% +4% -0% -6% +38% +19% -27% -50% +66%<br />
1'052<br />
1998 1999 2000 2001 2002 2003 2004 2005 2006 2007 2008 2009 2010<br />
1) Before restructuring cash-out<br />
2) Figures shown in the chart represent the restated historical sales of those businesses included in the current consolidation perimeter (i.e. SYS<br />
and PTC). Businesses previously included in <strong>Rieter</strong>'s Textile Systems Division and meanwhile divested (e.g. SwissTex) have been excluded<br />
throughout<br />
522<br />
865<br />
51
Machine business (SYS) – Market<br />
Strong recovery of shipments in 2010<br />
2008 2009 2010<br />
FAK/BMK 2010 March 2011<br />
439<br />
246<br />
North & South<br />
America<br />
Shipments in spindle equivalents (in ’000)<br />
500<br />
11’822<br />
Source: ITMF - International Textile Machinery Shipment Statistics (2008 and 2009), <strong>Rieter</strong> estimation (2010)<br />
182<br />
83<br />
Europe &<br />
Africa<br />
293<br />
9’578<br />
16’130<br />
Asia & Pacific (incl.<br />
Turkey)<br />
<strong>Autoneum</strong><br />
52
Component business (PTC) – Market<br />
FAK/BMK 2010 March 2011<br />
<strong>Autoneum</strong><br />
Addressable market based on global machinery installed and its<br />
replacement – a sound foundation for PTC`s business with spinning mills<br />
2008 2009 2010<br />
Installed base of machinery in spindle equivalents (in million spindles)<br />
22.4 22.5 22.9 30.3 30.4 28.2<br />
North & South<br />
America<br />
Europe &<br />
Africa<br />
Source: ITMF – International Textile Machinery Shipment Statistics (2008) and estimation of <strong>Rieter</strong> for (2009 and 2010)<br />
220.7 228.4 253.0<br />
Asia & Pacific<br />
(incl. Turkey)<br />
53
<strong>Rieter</strong> – Strategic intent<br />
FAK/BMK 2010 March 2011<br />
Strategic intent<br />
<strong>Autoneum</strong><br />
Growth strategy<br />
• Stay No. 1 in the high segment, become at least No. 2 in the mid segment<br />
• Strengthen position in China and India<br />
• Close product gaps through innovation and external opportunities<br />
Innovation<br />
• Improve yarn quality<br />
• Increase fiber yield / productivity<br />
• Achieve cost and energy savings (for spinning mills)<br />
Cycle management<br />
• Maintain break-even focus<br />
• Generate free cash flow throughout the cycle<br />
• Keep key know-how<br />
54
Overview of <strong>Rieter</strong>‘s Board of Directors and<br />
Management<br />
FAK/BMK 2010 March 2011<br />
General Counsel<br />
Thomas Anwander<br />
Spun Yarn Systems (SYS)<br />
Peter Gnägi<br />
Board of Directors<br />
Erwin Stoller, Chairman<br />
This E. Schneider, Dieter Spälti,<br />
Jakob Baer, Michael Pieper,<br />
Hans-Peter Schwald, Peter Spuhler<br />
Executive Chairman of the<br />
Board<br />
Erwin Stoller<br />
Premium Technology<br />
Components (PTC)<br />
Werner Strasser<br />
<strong>Autoneum</strong><br />
Chief Financial Officer<br />
Joris Gröflin<br />
55
Guidance over the cycle<br />
Sales<br />
EBIT margin<br />
Net result<br />
RONA<br />
Capex<br />
Dividend Policy<br />
FAK/BMK 2010 March 2011<br />
Over the cycle<br />
Sales growth of > 5%<br />
> 9% over the cycle,<br />
peak years > 12%<br />
> 6 % over the cycle,<br />
peak years > 8%<br />
peak years > 14%<br />
4 – 5 % of corporate output<br />
Target pay-out ratio of<br />
approx. 30% of net result<br />
<strong>Autoneum</strong><br />
56
Agenda<br />
. . . . .<br />
. . . . .<br />
. . . . .<br />
. . . . .<br />
. . . . .<br />
. . . . .<br />
. . . . .<br />
. . . . .<br />
. . . . .<br />
FAK/BMK 2010 March 2011<br />
<strong>Autoneum</strong><br />
1. Introduction Erwin Stoller<br />
2. Review of business year 2010 Urs Leinhäuser<br />
3. Separation of Textile Systems and Erwin Stoller/<br />
Automotive Systems Urs Leinhäuser<br />
4. Introducing the focused Automotive Business Erwin Stoller<br />
(<strong>Autoneum</strong>)<br />
5. Introducing the focused Textile business (<strong>Rieter</strong>) Erwin Stoller<br />
6. Summary: Outlook and steps for a successful future Erwin Stoller<br />
7. Q & A<br />
8. Appendix<br />
57
<strong>Rieter</strong> Group: Outlook<br />
FAK/BMK 2010 March 2011<br />
<strong>Autoneum</strong><br />
• As a leading supplier to the textile machinery and automobile industries, <strong>Rieter</strong> participated<br />
successfully in market recovery last year. Order intake and sales rose markedly throughout<br />
2010. Both divisions attained a positive operating income again, and the Group recorded a<br />
net profit.<br />
• Further development of the respective divisional markets mainly depends on consumer<br />
sentiment in Europe and North America, and on economic growth in the major Asian<br />
markets. Factors that can additionally influence business developments also include<br />
exchange rate effects, commodity prices such as crude oil, cotton, etc. – not to speak of<br />
disasters as for example in Japan in March 2011.<br />
• The cost reduction measures and restructuring projects largely completed per end of 2010<br />
have lowered our break-even point, and the <strong>Rieter</strong> Group cost position is now better than<br />
before the financial and economic crisis.<br />
• For 2011 as a whole, the <strong>Rieter</strong> Group therefore expects today a sales growth in the doubledigit<br />
percentage range, and a further improvement of the margin from operative activities<br />
also by comparison with the second half of 2010.<br />
58
Outlook<br />
FAK/BMK 2010 March 2011<br />
<strong>Autoneum</strong><br />
Textile business (<strong>Rieter</strong>) Automotive business (<strong>Autoneum</strong>)<br />
Thanks to the gratifying order backlog per<br />
beginning of year, and good ongoing<br />
demand for textile machinery and<br />
technology components, <strong>Rieter</strong> Textile<br />
Systems expects a substantial sales<br />
increase for 2011. This division expects a<br />
further improvement of operating margin<br />
compared with 2010 overall, primarily due to<br />
higher volumes both in the textile machinery<br />
and technology components businesses.<br />
Textile Systems plans additional<br />
investments to accelerate production plant<br />
expansion in Asia and thereby further<br />
improve market positioning in China and<br />
India.<br />
<strong>Rieter</strong> Automotive Systems expects further<br />
sales growth in 2011, which will not however<br />
profit from the same baseline effect as in 2010.<br />
Automotive Systems growth in Asia and North<br />
America is likely to be stronger than in other<br />
regions. Sales growth in local currencies is<br />
expected to be stronger than in Swiss francs<br />
due to appreciation of the latter against the<br />
Euro and US dollar. Automotive Systems<br />
expects for 2011 another significant<br />
improvement of operating margin. Contributions<br />
to this are expected from the European<br />
business region, which strives for a significantly<br />
reduced operating loss in 2011 compared with<br />
2010. Automotive Systems expects a positive<br />
net result for the year thanks to operating<br />
income improvements in 2011.<br />
59
Next Milestones<br />
AGM invitation and<br />
Shareholder<br />
Information Brochure<br />
2011 AGM • 13 April 2011<br />
Publication for listing<br />
prospectus for<br />
<strong>Autoneum</strong> Shares<br />
Cut-off date for<br />
entitlement to receive<br />
<strong>Autoneum</strong> Shares<br />
<strong>Rieter</strong> Holding Shares<br />
trade ex-dividend<br />
First trading for<br />
<strong>Autoneum</strong> shares on<br />
SIX<br />
FAK/BMK 2010 March 2011<br />
• 22 March 2011<br />
• 2 May 2011<br />
• 12 May 2011 (after close of trading on SIX)<br />
• 13 May 2011<br />
• 13 May 2011<br />
<strong>Autoneum</strong><br />
60
Summary<br />
• Turnaround and lower break-even point achieved<br />
• Strategy evaluated on division and group level<br />
FAK/BMK 2010 March 2011<br />
<strong>Autoneum</strong><br />
• Goal: two listed, focused companies and proposal to the Annual General Meeting<br />
to split the <strong>Rieter</strong> Group and to continue to operate the two divisions as separate entities<br />
61
Appendix Group<br />
FAK/BMK 2010 March 2011<br />
<strong>Autoneum</strong><br />
. . . . . . . . . . . . . . . . . . . . . . . . .<br />
. . . . . . . . . . . . . . . . . . . . . . . . .<br />
. . . . . . . . . . . . . . . . . . . . . . . . .<br />
62
<strong>Rieter</strong> Group: Capital expenditures and depreciation<br />
by division<br />
<strong>Autoneum</strong><br />
million CHF<br />
160<br />
140<br />
120<br />
100<br />
80<br />
60<br />
40<br />
20<br />
0<br />
62<br />
3.3% 1)<br />
56<br />
6<br />
FAK/BMK 2010 March 2011<br />
95<br />
46<br />
Capex 09 Deprec. 09 Capex 10 Deprec. 10<br />
1) in % of Corporate Output<br />
141<br />
7.6% 1)<br />
98<br />
3.9% 1)<br />
72<br />
26<br />
125<br />
4.9% 1)<br />
85<br />
40<br />
Textile Systems Automotive Systems<br />
• Capex increased by 36 to 98<br />
million CHF compared to<br />
2009<br />
• In both divisions capex were<br />
still carefully scrutinized<br />
which is of utmost<br />
importance also in an<br />
upswing<br />
• Only the most important<br />
projects got the “green light”<br />
• Capex in 2010 27 million<br />
CHF (22%) lower than<br />
depreciation<br />
• Capex volumes will continue<br />
to rise with market upswing<br />
and expansion in Asia<br />
63
Appendix Textile business<br />
FAK/BMK 2010 March 2011<br />
<strong>Autoneum</strong><br />
. . . . . . . . . . . . . . . . . . . . . . . . .<br />
. . . . . . . . . . . . . . . . . . . . . . . . .<br />
. . . . . . . . . . . . . . . . . . . . . . . . .<br />
64
Order intake<br />
million CHF<br />
800<br />
600<br />
400<br />
200<br />
0<br />
H1:<br />
309%<br />
180.2<br />
59.8<br />
120.4<br />
FAK/BMK 2010 March 2011<br />
Order intake (2009–2010) Comments<br />
302.3<br />
78.5<br />
223.8<br />
737.1 716.0<br />
112.0 123.2<br />
625.1 592.8<br />
H1 2009 H2 2009 H1 2010 H2 2010<br />
SYS PTC<br />
million CHF FY2009 FY2010 ∆ (%)<br />
SYS 344.2 1’217.9 254%<br />
PTC 138.3 235.2 70%<br />
Total<br />
482.5<br />
Order Backlog 193.8<br />
1’453.1<br />
747.3<br />
201%<br />
286%<br />
H2:<br />
137%<br />
<strong>Autoneum</strong><br />
• During FY2010, total orders received<br />
rose by approx. 970.6 million CHF or<br />
201% to 1’453.1 million CHF<br />
• Growth in local currencies was 208%<br />
• H1 2010 orders grew over-proportionally<br />
with 309% compared to 137% in H2<br />
2010 due to rapid market recovery in all<br />
regions<br />
• The strong increase in order intake of<br />
254% y-o-y in the SYS division is due to<br />
both new projects and replacement<br />
business<br />
• Orders in PTC increased by 70% y-o-y<br />
reflecting strong demand both by<br />
spinning mills and OEMs<br />
• Total order backlog stood at 747.3<br />
million CHF as at the end of 2010<br />
65
Key balance sheet data<br />
million CHF<br />
Cash and<br />
cash equivalents<br />
Total assets<br />
Interest<br />
bearing liabilities<br />
Other liabilities<br />
Equity incl.<br />
minority interest<br />
Total liabilities and<br />
equity<br />
FAK/BMK 2010 March 2011<br />
31.12.2010<br />
<strong>Rieter</strong> Group<br />
359.0<br />
1’969.1<br />
362.5<br />
979.0<br />
31.12.2010<br />
post separation 1)<br />
627.6 324.5<br />
1’969.1<br />
Net liquidity -3.5 94.0<br />
Equity ratio (%)<br />
31.9<br />
375.6<br />
1’119.3<br />
281.6<br />
513.2<br />
1’119.3<br />
29.0<br />
1) <strong>Rieter</strong> balance sheet ex-<strong>Autoneum</strong> as at 31 December 2010 pro-forma adjusted for the separation<br />
Comments<br />
<strong>Autoneum</strong><br />
• <strong>Rieter</strong> Group pre-separation with net<br />
liquidity of -3.5 million CHF as at yearend<br />
2010<br />
• Internal restructuring prior to<br />
separation<br />
• <strong>Rieter</strong> to waive 55 million CHF of<br />
debt in favor of <strong>Autoneum</strong><br />
• settlement of all outstanding<br />
intercompany liabilities<br />
• Resulting pro-forma net liquidity post<br />
separation of 94.0 million CHF<br />
• Interest bearing liabilities consist<br />
essentially of the 250 million CHF,<br />
4.5% bond due 2015<br />
• Equity ratio of 29.0% pro-forma post<br />
separation<br />
66
New segment information – pro forma for <strong>Rieter</strong> going<br />
forward<br />
<strong>Autoneum</strong><br />
<strong>Rieter</strong><br />
(Textile)<br />
2009 (1)<br />
<strong>Rieter</strong><br />
(Textile)<br />
2010 (1)<br />
(1) Pro-forma (unaudited), without divested units; deviates from segment reporting <strong>Rieter</strong><br />
FAK/BMK 2010 March 2011<br />
Mio CHF<br />
Sales<br />
Corporate output<br />
EBITDA<br />
Depreciation and amortization<br />
EBIT<br />
Capital expenditure<br />
Number of employees<br />
Mio CHF<br />
Sales<br />
Corporate output<br />
EBITDA<br />
Depreciation and amortization<br />
EBIT<br />
Capital expenditure<br />
Number of employees<br />
SYS PTC Other Total<br />
394.2 128.1 0.0 522.3<br />
355.7 126.1 0.0 481.8<br />
-21.2 1.5 -7.4 -27.1<br />
-22.2 -21.7 -0.4 -44.3<br />
-43.4 -20.2 -7.8 -71.4<br />
3.7 1.8 0.0 5.5<br />
3’026 1’005 30 4’061<br />
SYS PTC Other Total<br />
674.0 190.6 0.0 864.6<br />
669.4 237.0 0.0 906.4<br />
63.4 48.3 -9.8 101.9<br />
-21.0 -18.7 -0.2 -39.9<br />
42.4 29.6 -10.0 62.0<br />
21.3 4.5 0.0 25.8<br />
3’434 924 30 4’388<br />
67
Appendix Automotive business<br />
FAK/BMK 2010 March 2011<br />
<strong>Autoneum</strong><br />
. . . . . . . . . . . . . . . . . . . . . . . . .<br />
. . . . . . . . . . . . . . . . . . . . . . . . .<br />
. . . . . . . . . . . . . . . . . . . . . . . . .<br />
68
Historical sales<br />
Net sales (2006 – 2010) Comments<br />
CHF MM<br />
2,500<br />
2,000<br />
1,500<br />
1,000<br />
500<br />
0<br />
2,115<br />
FAK/BMK 2010 March 2011<br />
2,295<br />
(1) (1)<br />
1,960<br />
149<br />
45<br />
514<br />
1,222<br />
128<br />
52<br />
403<br />
794<br />
150<br />
77<br />
549<br />
897<br />
2006A 2007A 2008A 2009A 2010A<br />
BG Europe BG North America BG Asia BG SAMEA Group<br />
(1) Based on <strong>Autoneum</strong>’s internal non-audited data<br />
(2) Total net sales for the <strong>Autoneum</strong> Group include “Other activities” (sales generated by <strong>Autoneum</strong>’s tooling activities and R&T activitiesand<br />
sales generated by the IDEA Group, which was sold in June 2010) in addition to business group sales<br />
(2)<br />
1,387<br />
+21%<br />
(2)<br />
1,678<br />
(2)<br />
<strong>Autoneum</strong><br />
• In 2008 through 2009, steep decline of vehicle<br />
production in <strong>Autoneum</strong>’s main markets across<br />
most customers<br />
• In H2 2009 and 2010, <strong>Autoneum</strong> benefited from<br />
improving market conditions<br />
• Organic growth in all regions thanks to a broad<br />
global customer and product portfolio set-up<br />
• Strongest revenue recovery in North and<br />
South America<br />
• Strong growth in Asia driven by new orders and<br />
recent opening of new facilities in China and<br />
India<br />
• In Europe volume stabilized and started to<br />
recover in 2010<br />
• In local currency, growth 2009/2010 would<br />
equal +25%<br />
69
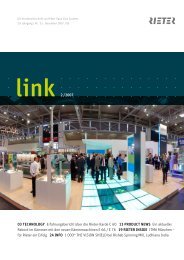
Significant reduction of break-even level<br />
Break-even structurally reduced by 21% from 2008 to 2010<br />
Net sales at which EBIT break-even is achieved<br />
CHF MM<br />
Underlying<br />
net sales<br />
assumption<br />
2.000<br />
1.900<br />
1.800<br />
1.700<br />
1.600<br />
FAK/BMK 2010 March 2011<br />
(21%)<br />
0<br />
2008 2009 2010<br />
1’960 1’387 1’678<br />
Comments<br />
<strong>Autoneum</strong><br />
Significant structural break-even<br />
adjustment through restructuring<br />
• Total manufacturing capacity aligned in<br />
Europe and North America<br />
• 8 plants operationally closed<br />
• overhead cost reduced<br />
• Footprint in Europe aligned to increase<br />
portion of production in Eastern Europe<br />
(in line with customer footprint)<br />
70
Key historical financials per business groups<br />
Net sales evolution (2008 – 2010)<br />
CHF MM<br />
1,400<br />
1,200<br />
1,000<br />
800<br />
600<br />
400<br />
200<br />
0<br />
CHF MM<br />
80<br />
60<br />
40<br />
20<br />
0<br />
-20<br />
1,222<br />
514<br />
FAK/BMK 2010 March 2011<br />
794<br />
403<br />
149 128 150<br />
45 52 77<br />
2008 2009 2010<br />
BG Europe BG North America BG Asia BG SAMEA<br />
44<br />
1,960 (1)<br />
34<br />
1<br />
1,387 (1)<br />
EBITDA (before special charges) evolution (2008 – 2010) (2)<br />
23<br />
2008 -12<br />
2009 2010<br />
-40<br />
-60<br />
-46<br />
EBITDA margin % 3.6% 6.7% 1.8% (7.8%) (5.8%) 5.6% 6.2% 3.4% 2.2% 10.5% 11.9% 8.8%<br />
BG Europe BG North America BG Asia BG SAMEA<br />
3<br />
4<br />
897<br />
20<br />
549<br />
1,678 (1)<br />
79 (1) -22 (1) 107 (1)<br />
(1) Total net sales for the <strong>Autoneum</strong> Group include “Other activities” (sales generated by <strong>Autoneum</strong>’s tooling activities and R&T activities and sales generated by the<br />
IDEA Group, which was sold in June 2010) in addition to business group sales<br />
58<br />
9<br />
13<br />
<strong>Autoneum</strong><br />
Comments<br />
• BG Europe and BG North<br />
America severely impacted by<br />
financial crisis<br />
• Initiated restructuring program<br />
and operational performance<br />
improvement measures<br />
reduced cost base<br />
• BG North America’s volume<br />
recovered in 2010,<br />
restructuring and operational<br />
performance improvement<br />
measures drove profitability<br />
above 2008 level<br />
• BG Europe’s profitability in<br />
2010 recovered to 2008 level<br />
despite considerably lower<br />
volumes as a result of<br />
structural improvements and<br />
operational performance<br />
improvement<br />
• Accelerating growth in BG Asia<br />
driven by focused investment<br />
strategy<br />
71
Historical capital expenditure and R&D<br />
Capital expenditure (2008 – 2010) Comments<br />
CHF MM in % of net sales<br />
120<br />
4.4%<br />
4.5%<br />
90<br />
85<br />
4.1%<br />
4.3%<br />
72<br />
3.0%<br />
60<br />
56<br />
30<br />
0<br />
Research & development (2008 – 2010)<br />
FAK/BMK 2010 March 2011<br />
2008 2009 2010<br />
Note: Excluding restructuring related investments, margin as % of net sales<br />
1.5%<br />
0.0%<br />
CHF MM in % of net sales<br />
120<br />
80<br />
40<br />
0<br />
Note: Margin as % of net sales<br />
4.2%<br />
5.3%<br />
81 74<br />
3.9%<br />
2008 2009 2010<br />
66<br />
y<br />
6.0%<br />
5.0%<br />
4.0%<br />
3.0%<br />
2.0%<br />
1.0%<br />
0.0%<br />
<strong>Autoneum</strong><br />
• Majority of the investments in property, plant and<br />
equipment were made in connection with new<br />
awarded businesses or to increase efficiency<br />
• Level of 4.0-4.5% of net sales achieved from<br />
2008 to 2010 (excluding performance<br />
improvement related investments)<br />
Comments<br />
• Continued research and development activities<br />
are crucial to maintaining <strong>Autoneum</strong>’s<br />
technological leadership<br />
• Developments include applications for new,<br />
customized acoustic products and investments<br />
made into new processes and materials<br />
• No development costs were capitalized<br />
72
Historical operating working capital<br />
Operating working capital (2008 – 2010)<br />
CHF MM in % of net sales<br />
400<br />
350<br />
300<br />
250<br />
200<br />
150<br />
100<br />
50<br />
0<br />
12.4%<br />
244<br />
Note: Including inventories, trade receivables, advance payments to suppliers, trade payables, advance payments by customers<br />
FAK/BMK 2010 March 2011<br />
14.2%<br />
198<br />
9.4%<br />
158<br />
2008 2009 2010<br />
16.0%<br />
14.0%<br />
12.0%<br />
10.0%<br />
8.0%<br />
6.0%<br />
4.0%<br />
2.0%<br />
0.0%<br />
Comments<br />
<strong>Autoneum</strong><br />
• Operating working capital requirement was<br />
significantly reduced to 9.4% of net sales despite<br />
increased sales<br />
• Improvements driven by improved inventory<br />
management since 2008<br />
• Absolute operating working capital levels in 2010<br />
positively impacted by the stronger CHF vs USD<br />
and EUR<br />
73
Capitalization table<br />
Capitalization Table<br />
As of December 31, 2010<br />
(in CHF million) Actual Adj.<br />
FAK/BMK 2010 March 2011<br />
As<br />
adjusted<br />
Cash pool receivables - <strong>Rieter</strong> 26 (26) –<br />
Cash and cash equivalents 123 - 123<br />
Equity attributable to <strong>Rieter</strong> 193 (193) –<br />
Equity attributable to shareholders – 248 248<br />
Equity attributable to noncontrolling<br />
interests 55 – 55<br />
Total Equity 248 55 303<br />
Long-term financial debt - <strong>Rieter</strong> 85 (85) –<br />
Long-term financial debt 18 (2) 125 143<br />
Borrowings non-current 103 40 143<br />
Short-term financial debt - <strong>Rieter</strong> 136 (136) –<br />
Short-term financial debt 63 15 (3) 77<br />
Borrowings current 199 (121) 77<br />
Total Capitalization 550 (26) 524<br />
(1)<br />
(1)<br />
(1)<br />
Comments<br />
(1) Not audited<br />
(2) Assumed borrowing of the new senior secured term loan and subordinated shareholder loans (pro-forma as per December 31, 2010)<br />
(3) Assumed borrowing under the new senior secured revolving facility (pro-forma as per December 31, 2010)<br />
<strong>Autoneum</strong><br />
• Shareholder’s equity will increase by CHF 55<br />
MM, equivalent to the debt amount waived by<br />
<strong>Rieter</strong> Holding prior to the separation<br />
• At execution of the separation <strong>Autoneum</strong>’s<br />
existing debt to <strong>Rieter</strong> Group will be refinanced<br />
by a portion of new bank loan facilities,<br />
consisting of<br />
• CHF 135 MM senior secured revolving facility<br />
• CHF 100 MM senior secured term loan; and<br />
• CHF 50 MM senior secured guarantee facility,<br />
to be used for guarantees.<br />
• <strong>Autoneum</strong> will receive subordinated shareholder<br />
loans in the amount of CHF 25 MM<br />
74
Historical combined income statements<br />
CHF million 2010 2009 2008<br />
Sales 1,715.4 1,424.3 2,022.1<br />
Sales deductions -37.9 -37.7 -61.9<br />
Net sales 1,677.5 1,386.6 1,960.2<br />
Change in semi-finished and finished goods 6.6 0.0 0.7<br />
Own work capitalized 0.0 0.1 0.5<br />
Corporate output 1,684.1 1,386.7 1,961.4<br />
Material costs -828.8 -682.9 -963.7<br />
Employee costs -488.9 -464.5 -589.2<br />
Other operating expenses -266.6 -265.7 -338.2<br />
Other operating income 7.4 4.9 8.6<br />
Operating result before depreciation, amortization and special charges<br />
(EBITDA before special charges) 107.2 -21.5 78.9<br />
Depreciation and amortization<br />
Operating result before special charges<br />
-84.9 -94.3 -100.4<br />
(EBIT before special charges) 22.3 -115.8 -21.5<br />
Special charges 0.0 0.0 -243.7<br />
Operating result (EBIT) 22.3 -115.8 -265.2<br />
Financial income 1.4 10.8 8.1<br />
Financial expenses -47.3 -35.5 -54.6<br />
Result before taxes -23.6 -140.5 -311.7<br />
Income taxes -17.7 -6.7 -15.0<br />
Net result -41.3 -147.2 -326.7<br />
Attributable to <strong>Rieter</strong> -56.1 -154.7 -337.7<br />
Attributable to non-controlling interests 14.8 7.5 11.0<br />
Earnings per share (CHF) -12.01 -33.11 -72.28<br />
FAK/BMK 2010 March 2011<br />
<strong>Autoneum</strong><br />
75
Historical combined balance sheets<br />
December 31, December 31, December 31,<br />
CHF million<br />
Assets<br />
2010 2009 2008<br />
Tangible fixed assets 388.4 451.1 482.4<br />
Intangible assets 0.0 0.0 0.1<br />
Other non-current assets 39.1 44.1 50.5<br />
Deferred tax assets 4.6 4.1 3.5<br />
Non-current assets 432.1 499.3 536.5<br />
Inventories 135.0 145.8 173.1<br />
Trade receivables 262.1 269.4 286.7<br />
Advance payments to suppliers 7.0 6.2 5.7<br />
Other receivables - <strong>Rieter</strong> 3.9 0.6 0.3<br />
Other receivables 31.3 45.8 51.8<br />
Marketable securities 1.2 0.4 0.5<br />
Cash pool receivables - <strong>Rieter</strong> 26.4 64.8 60.2<br />
Cash and cash equivalents 123.4 65.5 62.9<br />
Current assets 590.3 598.5 641.2<br />
Assets 1,022.4 1,097.8 1,177.7<br />
Equity and liabilities<br />
Equity attributable to <strong>Rieter</strong> 193.0 -157.7 -29.4<br />
Equity attributable to non-controlling interests 55.1 52.4 52.8<br />
Total equity 248.1 -105.3 23.4<br />
Long-term financial debt - <strong>Rieter</strong> 85.0 360.5 354.6<br />
Long-term financial debt 18.2 14.7 24.0<br />
Deferred tax liabilities 7.4 9.1 8.6<br />
Provisions 75.6 76.3 118.6<br />
Other non-current liabilities 0.8 1.3 0.9<br />
Non-current liabilities 187.0 461.9 506.7<br />
Short-term financial debt - <strong>Rieter</strong> 136.1 212.8 167.9<br />
Short-term financial debt 62.7 71.3 56.0<br />
Trade payables 211.2 182.9 183.1<br />
Advance payments by customers 34.9 41.0 38.5<br />
Current tax liabilities 9.2 12.8 15.2<br />
Provisions 39.0 118.2 90.2<br />
Other current liabilities - <strong>Rieter</strong> 6.4 3.3 6.9<br />
Other current liabilities 87.8 98.9 89.8<br />
Current liabilities 587.3 741.2 647.6<br />
Liabilities 774.3 1,203.1 1,154.3<br />
Equity and liabilities 1,022.4 1,097.8 1,177.7<br />
FAK/BMK 2010 March 2011<br />
Available liquid funds of CHF<br />
149.8 million as per 31<br />
December 2010<br />
Total long-term financial debt of<br />
CHF 103.2 million as per 31<br />
December 2010<br />
Total short-term financial debt<br />
of CHF 198.8 million as per 31<br />
December 2010<br />
<strong>Autoneum</strong><br />
76
Historical combined statements of cash flows<br />
CHF million 2010 2009 2008<br />
Net result -41.3 -147.2 -326.7<br />
Dividend income 0.0 -3.4 -2.2<br />
Interest income -1.3 -1.9 -5.3<br />
Interest expenses 38.7 35.5 30.4<br />
Income taxes 17.7 6.7 15.0<br />
Depreciation and amortization of tangible and intangible fixed assets 84.9 94.3 155.8<br />
Other non-cash income and expenses -2.4 -0.6 0.8<br />
Change in inventories -7.4 28.3 23.2<br />
Change in trade receivables -34.9 18.6 118.9<br />
Change in advance payments to suppliers -0.8 -0.5 0.2<br />
Change in trade payables 50.8 -0.9 -103.6<br />
Change in advance payments by customers -1.6 2.5 -8.5<br />
Change in provisions -44.6 -14.6 153.9<br />
Change in other receivables 6.3 5.7 10.3<br />
Change in other liabilities 1.3 5.9 -9.0<br />
Dividends received 0.0 3.4 2.2<br />
Interest received 1.3 1.9 5.3<br />
Interest paid -38.7 -35.5 -30.4<br />
Taxes paid -21.1 -9.2 -22.5<br />
Net cash from operating activities 6.9 -11.0 7.8<br />
Capital expenditure on tangible and intangible assets -72.4 -56.2 -85.3<br />
Proceeds from disposals of tangible and intangible assets 6.1 1.7 6.5<br />
Investments in non-current assets -0.4 -0.1 0.0<br />
Proceeds from disposals of non-current assets 0.0 0.0 1.1<br />
Change in holdings of marketable securities -0.9 0.1 -0.3<br />
Divestments of businesses -4.4 0.0 0.0<br />
Net cash used for investing activities -72.0 -54.5 -78.0<br />
Dividends paid to <strong>Rieter</strong> -12.0 -41.5 -16.5<br />
Dividends paid to non-controlling interests -6.1 -9.2 -6.8<br />
Proceeds from capital increases - <strong>Rieter</strong> 3.6 0.0 0.0<br />
Increase/decrease cash pool receivables - <strong>Rieter</strong> 36.4 18.7 -2.6<br />
Increase/decrease short-term financial debt - <strong>Rieter</strong> 89.1 71.3 66.1<br />
Increase/decrease other short-term financial debt -8.3 15.3 23.1<br />
Proceeds from long-term financial debt - <strong>Rieter</strong> 19.4 40.0 40.9<br />
Repayments of long-tem financial debt - <strong>Rieter</strong> 0.0 -17.5 -2.9<br />
Proceeds from other long-term financial debt 6.8 0.0 2.5<br />
Repayments of other long-term financial debt -3.3 -9.3 -21.4<br />
Net cash from financing activities 125.6 67.8 82.4<br />
Currency effects -2.6 0.3 -2.5<br />
Change in cash and cash equivalents 57.9 2.6 9.7<br />
Cash and cash equivalents at beginning of the year 65.5 62.9 53.2<br />
Cash and cash equivalents at end of the year 123.4 65.5 62.9<br />
FAK/BMK 2010 March 2011<br />
<strong>Autoneum</strong><br />
77
New segment information – historical combined for<br />
<strong>Autoneum</strong><br />
<strong>Autoneum</strong><br />
<strong>Autoneum</strong><br />
2009 (1)<br />
<strong>Autoneum</strong><br />
2010 (1)<br />
(1) Historical combined financial information; deviates from segment reporting <strong>Rieter</strong><br />
FAK/BMK 2010 March 2011<br />
Mio CHF<br />
Net sales<br />
EBITDA<br />
Depreciation and amortization<br />
EBIT<br />
Assets<br />
Liabilities<br />
Net assets<br />
Capital expenditure<br />
Number of employees<br />
Mio CHF<br />
Net sales<br />
EBITDA<br />
Depreciation and amortization<br />
EBIT<br />
Assets<br />
Liabilities<br />
Net assets<br />
Capital expenditure<br />
Number of employees<br />
BG BG North<br />
BG<br />
Europe America BG Asia SAMEA Other Total<br />
794.2 403.1 52.0 127.6 9.7 1’386.6<br />
-46.4 22.7 3.2 4.4 -5.4 -21.5<br />
-55.2 -27.4 -5.2 -3.7 -2.8 -94.3<br />
-101.6 -4.7 -2.0 0.7 -8.2 -115.8<br />
585.9 237.4 56.3 53.5 164.7 1’097.8<br />
357.7 101.6 22.2 29.8 691.8 1’203.1<br />
228.2 135.8 34.1 23.7 -527.1 105.3<br />
27.1 15.7 10.3 2.6 0.5 56.2<br />
4’037 2’024 773 1’258 508 8’600<br />
BG BG North<br />
BG<br />
Europe America BG Asia SAMEA Other Total<br />
897.1 548.9 76.7 149.5 5.3 1’677.5<br />
20.0 57.6 9.1 13.1 7.4 107.2<br />
-47.8 -25.6 -5.6 -4.0 -1.9 -84.9<br />
-27.8 32.0 3.5 9.1 5.5 22.3<br />
500.2 235.1 65.4 54.2 167.5 1’022.4<br />
307.3 103.0 23.3 31.1 309.6 774.3<br />
192.9 132.1 42.1 23.1 -142.1 248.1<br />
34.7 22.9 9.6 4.0 1.2 72.4<br />
3’732 2’286 895 1’195 301 8’409<br />
78