2009 ANNUAL REPORT FINANCIAL SUPPLEMENTS - BDO
2009 ANNUAL REPORT FINANCIAL SUPPLEMENTS - BDO
2009 ANNUAL REPORT FINANCIAL SUPPLEMENTS - BDO
- No tags were found...

Create successful ePaper yourself
Turn your PDF publications into a flip-book with our unique Google optimized e-Paper software.
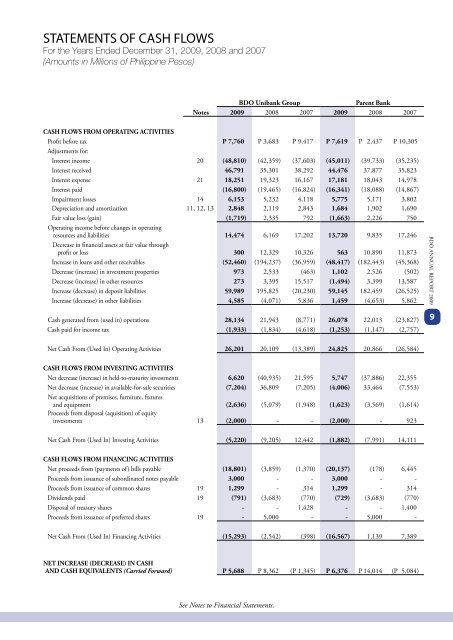
STATEMENTS OF CASH FLOWSFor the Years Ended December 31, <strong>2009</strong>, 2008 and 2007(Amounts in Millions of Philippine Pesos)<strong>BDO</strong> Unibank GroupParent BankNotes <strong>2009</strong> 2008 2007 <strong>2009</strong> 2008 2007CASH FLOWS FROM OPERATING ACTIVITIESProfit before tax P 7,760 P 3,683 P 9,417 P 7,619 P 2,437 P 10,305Adjustments for:Interest income 20 (48,810) (42,359) (37,603) (45,011) (39,733) (35,235)Interest received 46,791 35,301 38,292 44,476 37,877 35,823Interest expense 21 18,251 19,323 16,167 17,181 18,043 14,978Interest paid (16,800) (19,465) (16,824) (16,341) (18,088) (14,867)Impairment losses 14 6,153 5,232 4,118 5,775 5,171 3,802Depreciation and amortization 11, 12, 13 2,848 2,119 2,843 1,684 1,902 1,690Fair value loss (gain) (1,719) 2,335 792 (1,663) 2,226 750Operating income before changes in operatingresources and liabilities 14,474 6,169 17,202 13,720 9,835 17,246Decrease in financial assets at fair value throughprofit or loss 300 12,329 10,326 563 10,890 11,873Increase in loans and other receivables (52,460) (194,237) (36,959) (48,417) (182,443) (45,368)Decrease (increase) in investment properties 973 2,533 (463) 1,102 2,526 (502)Decrease (increase) in other resources 273 3,395 15,517 (1,494) 3,399 13,587Increase (decrease) in deposit liabilities 59,989 195,825 (20,230) 59,145 182,459 (26,525)Increase (decrease) in other liabilities 4,585 (4,071) 5,836 1,459 (4,653) 5,862<strong>BDO</strong> <strong>ANNUAL</strong> <strong>REPORT</strong> <strong>2009</strong>Cash generated from (used in) operations 28,134 21,943 (8,771) 26,078 22,013 (23,827)Cash paid for income tax (1,933) (1,834) (4,618) (1,253) (1,147) (2,757)9Net Cash From (Used In) Operating Activities 26,201 20,109 (13,389) 24,825 20,866 (26,584)CASH FLOWS FROM INVESTING ACTIVITIESNet decrease (increase) in held-to-maturity investments 6,620 (40,935) 21,595 5,747 (37,886) 22,355Net decrease (increase) in available-for-sale securities (7,204) 36,809 (7,205) (4,006) 33,464 (7,553)Net acquisitions of premises, furniture, fixturesand equipment (2,636) (5,079) (1,948) (1,623) (3,569) (1,614)Proceeds from disposal (aquisition) of equityinvestments 13 (2,000) - - (2,000) - 923Net Cash From (Used In) Investing Activities (5,220) (9,205) 12,442 (1,882) (7,991) 14,111CASH FLOWS FROM FINANCING ACTIVITIESNet proceeds from (payments of) bills payable (18,801) (3,859) (1,370) (20,137) (178) 6,445Proceeds from issuance of subordinated notes payable 3,000 - - 3,000 - -Proceeds from issuance of common shares 19 1,299 - 314 1,299 - 314Dividends paid 19 (791) (3,683) (770) (729) (3,683) (770)Disposal of treasury shares - - 1,428 - - 1,400Proceeds from issuance of preferred shares 19 - 5,000 - - 5,000 -Net Cash From (Used In) Financing Activities (15,293) (2,542) (398) (16,567) 1,139 7,389NET INCREASE (DECREASE) IN CASHAND CASH EQUIVALENTS (Carried Forward) P 5,688 P 8,362 (P 1,345) P 6,376 P 14,014 (P 5,084)See Notes to Financial Statements.