NCC Report No. 1 - (IMD), Pune
NCC Report No. 1 - (IMD), Pune
NCC Report No. 1 - (IMD), Pune

Create successful ePaper yourself
Turn your PDF publications into a flip-book with our unique Google optimized e-Paper software.
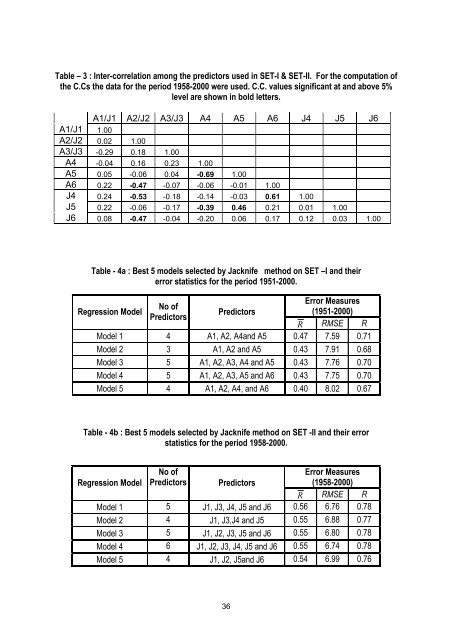
Table – 3 : Inter-correlation among the predictors used in SET-I & SET-II. For the computation ofthe C.Cs the data for the period 1958-2000 were used. C.C. values significant at and above 5%level are shown in bold letters.A1/J1 A2/J2 A3/J3 A4 A5 A6 J4 J5 J6A1/J1 1.00A2/J2 0.02 1.00A3/J3 -0.29 0.18 1.00A4 -0.04 0.16 0.23 1.00A5 0.05 -0.06 0.04 -0.69 1.00A6 0.22 -0.47 -0.07 -0.06 -0.01 1.00J4 0.24 -0.53 -0.18 -0.14 -0.03 0.61 1.00J5 0.22 -0.06 -0.17 -0.39 0.46 0.21 0.01 1.00J6 0.08 -0.47 -0.04 -0.20 0.06 0.17 0.12 0.03 1.00Table - 4a : Best 5 models selected by Jacknife method on SET –I and theirerror statistics for the period 1951-2000.Regression Model<strong>No</strong> ofPredictorsError Measures(1951-2000)PredictorsR RMSE RModel 1 4 A1, A2, A4and A5 0.47 7.59 0.71Model 2 3 A1, A2 and A5 0.43 7.91 0.68Model 3 5 A1, A2, A3, A4 and A5 0.43 7.76 0.70Model 4 5 A1, A2, A3, A5 and A6 0.43 7.75 0.70Model 5 4 A1, A2, A4, and A6 0.40 8.02 0.67Table - 4b : Best 5 models selected by Jacknife method on SET -II and their errorstatistics for the period 1958-2000.Regression Model<strong>No</strong> ofPredictorsError Measures(1958-2000)PredictorsR RMSE RModel 1 5 J1, J3, J4, J5 and J6 0.56 6.76 0.78Model 2 4 J1, J3,J4 and J5 0.55 6.88 0.77Model 3 5 J1, J2, J3, J5 and J6 0.55 6.80 0.78Model 4 6 J1, J2, J3, J4, J5 and J6 0.55 6.74 0.78Model 5 4 J1, J2, J5and J6 0.54 6.99 0.7636