Proposed Limpopo West Mine Concept Study ... - SRK Consulting
Proposed Limpopo West Mine Concept Study ... - SRK Consulting
Proposed Limpopo West Mine Concept Study ... - SRK Consulting

Create successful ePaper yourself
Turn your PDF publications into a flip-book with our unique Google optimized e-Paper software.
PD’s View of Developmental Directions❏ Written in 1996Tuesday, March 27, 2001 4:04 PM Page 31
<strong>SRK</strong> <strong>Consulting</strong>: 447493: <strong>Limpopo</strong> <strong>West</strong> GeochemPage ivTestworkMetalLeaching<strong>Limpopo</strong> <strong>West</strong> Leased area(WRC <strong>Study</strong>)Mafutha Project areaWaterbergCoalfield (IGS,2009)Al, Fe, Al, Fe Not undertakenSalinity SO 4, Ca, Mg SO 4, Cl, F, Ca, Mg Not undertakenExistingPit Lakelow Al and Fe; low SO 4, alkaline pH low Al and Fe; low SO 4, alkaline pH Not undertakenResultsAcidic except for Welgelegen shallow,Fe and Al rich, saline leachMST, MST-C, SST and C acidic, Feand Al rich, saline leachMST-C, CSH, SSTand Discard AcidicRecommendationsBased on the potential mine water quality impacts identified to generate acidity, the following sectiondescribes the associated mitigation measures that the PLWM project is required to implement,aimed at reducing potential negative environmental impacts.Construction and Operational Phase Mitigation MeasuresThe following operational ARDML management strategy is proposed for the PLWM operations:Isolate future mining and backfill areas from the current mine water management reticulationsystem;Selective handling of PAG and Non-PAG spoils. The spoils should be stockpiled in a mannerthat allows PAG material to be accessed first during backfilling so it can be placed at the bottomof the pit. This will require site specific geochemical characterisation of the individual lithologicalunits;Determine and agree effluent discharge standards with Authorities that need to be adhered to bythe mine during the operational and closure phases and resolve the question around currentdischarge qualities and exceedence;Develop and implement a mine water quality monitoring system for mine water generated fromnew mining areas and backfill areas;The mine water generated from these areas should have mine water management infrastructurein place ;If the quality of the mine water falls within the agreed mine water discharge quality parameters, itcan be released to the current mine water reticulation system and managed in the same way asthe current mine water is managed (assuming it is upgraded to handle the additional mine waterflows); andIf the quality exceeds the agreed mine water quality discharge parameters, the mine water willbe managed in a separate mine water reticulation system that either allows for use elsewhere inthe operation and/or storage (unlikely due to safety concerns) and/or treatment, discharge or reuse.An ARD management plan should be developed and implemented to manage the ARD risk from thepit and spoils stockpiles. It should consist of:Acid base accounting (ABA) testing of the individual key lithologies to determine ARD risk andavailability of excess neutralising potential for ARD risk reduction. The ABA monitoring should bedone annually for first two years where after the monitoring programme should be revised aspart of the ARD management plan.Incorporation of ABA results into the existing block model to indicate areas or material types ofhigh, low and medium ARD risk potential.Field kinetic test programme including the installation of field lysimeters on site to assess sitespecific metal leaching rates and drainage quality for inclusion in the monitoring database.Undertake geochemical modelling to evaluate the potential pit lake chemistry at post closure andthis will include the following tasks:oNumerical predictions using hydrogeological flow models to predict potentialgroundwater flow that will influence the pit water quality,GOGP/LAKJ Report_April2013_19April2013 (1)_Final_Ludi_22052013 April 2013
<strong>SRK</strong> <strong>Consulting</strong>: 447493: <strong>Limpopo</strong> <strong>West</strong> GeochemPage viTable of ContentsExecutive Summary ..................................................................................................................................... iiConstruction and Operational Phase Mitigation Measures................................................................ ivList of Figures ................................................................................................................. viiiDisclaimer .................................................................................................................................................... ixGlossary, Acronyms and Abbreviations .......................................................................... x1 Introduction ................................................................................................................ 122 Project Description ..................................................................................................... 122.1 Locality .............................................................................................................................................. 122.2 Climate .............................................................................................................................................. 142.3 Geology ............................................................................................................................................. 142.4 Hydrology and Hydrogeology ............................................................................................................ 162.5 <strong>Mine</strong> Plan .......................................................................................................................................... 162.6 Processing ........................................................................................................................................ 183 Objectives and Work program .................................................................................. 183.1 Objectives ......................................................................................................................................... 183.2 Work Program ................................................................................................................................... 184 Assumptions and Limitations ................................................................................... 185 Geochemical Characterisation .................................................................................. 195.1 Approach and Methodology .............................................................................................................. 195.1.1 Reviewed Reports ................................................................................................................. 205.2 Sampling ........................................................................................................................................... 205.3 Data analysis and interpretation ....................................................................................................... 235.3.1 Acid Base Accounting ........................................................................................................... 235.3.2 NAG Test ............................................................................................................................... 255.3.3 Metal Leachibility ................................................................................................................... 275.3.4 Pit Water ................................................................................................................................ 305.4 Comparison with Previous Studies ................................................................................................... 345.4.1 IGS <strong>Study</strong> (2009) – Groundwater Resource Assessment of the Waterberg Coal Reserves 345.4.2 Sasol Mafutha (<strong>SRK</strong>, 2011)................................................................................................... 355.4.3 Summary ............................................................................................................................... 376 Geochemical Impact ................................................................................................... 386.1 Recommended Mitigation Measures ................................................................................................ 386.1.1 Construction and Operational Phase Mitigation Measures ................................................... 386.1.2 Decommissioning and Closure Phase Mitigation Measures ................................................. 397 CONCLUSION ............................................................................................................. 408 References .................................................................................................................. 42GOGP/LAKJ Report_April2013_19April2013 (1)_Final_Ludi_22052013 April 2013
<strong>SRK</strong> <strong>Consulting</strong>: 447493: <strong>Limpopo</strong> <strong>West</strong> GeochemPage viiAppendices ...................................................................................................................... 43Appendix A: Summary of Laboratory Results ............................................................ 44GOGP/LAKJ Report_April2013_19April2013 (1)_Final_Ludi_22052013 April 2013
<strong>SRK</strong> <strong>Consulting</strong>: 447493: <strong>Limpopo</strong> <strong>West</strong> GeochemPage viiiList of TablesTable 2-1: <strong>Proposed</strong> Phases of Mining at <strong>Limpopo</strong> <strong>West</strong> ................................................................................ 16Table 2-2: Description of envisaged <strong>Mine</strong> Facility ............................................................................................ 17Table 5-1: Summary of Exploration Boreholes sampled by IGS ...................................................................... 20Table 6-1: ARD Criteria based on NPR (MEND and GARD systems) ............................................................. 23Table 6-5: Pit Water Monitoring Data ............................................................................................................... 31Table 6-6: Summary of Findings ...................................................................................................................... 35Table 6-7: Summary of Geochemical Samples submitted for laboratory test-work ......................................... 35Table 6-8: Comparison of ABA and NAG findings ........................................................................................... 36Table 6-9: Summary of all Studies ................................................................................................................... 37List of FiguresFigure 2-1: Generalised Stratigraphic Column of the Coal-bearing interval in the Waterberg coalfield (AfterSnyman, 1998) ........................................................................................................................... 15Figure 2-2: Location of <strong>Study</strong> Area ................................................................................................................... 13Figure 5-1: Locality of Sampled Exploration Boreholes ................................................................................... 22Figure 6-1: Open System NNP vs. pH (initial and final) ................................................................................... 25Figure 6-2: AP vs NP (NPR) ............................................................................................................................. 24Figure 6-3: Ficklin metal concentrations against sulfuric acid leach pH ........................................................... 27Figure 6-4: Ratio of the sum of Calcium and Magnesium to Sulfate as meq/l ................................................. 29Figure 6-5: Ficklin metal concentrations against contact leach pH .................................................................. 30Figure 6-6: Ratio of the sum of Calcium and Magnesium to Sulfate as meq/l ................................................. 33GOGP/LAKJ Report_April2013_19April2013 (1)_Final_Ludi_22052013 April 2013
<strong>SRK</strong> <strong>Consulting</strong>: 447493: <strong>Limpopo</strong> <strong>West</strong> GeochemPage ixDisclaimerThe opinions expressed in this Report have been based on the information supplied to <strong>SRK</strong><strong>Consulting</strong> (South Africa)(Pty) Ltd (<strong>SRK</strong>) by Sasol Mining Pty (Ltd) (Sasol). The opinions in thisReport are provided in response to a specific request from Sasol to do so. <strong>SRK</strong> has exercised alldue care in reviewing the supplied information. Whilst <strong>SRK</strong> has compared key supplied data withexpected values, the accuracy of the results and conclusions from the review are entirely reliant onthe accuracy and completeness of the supplied data. <strong>SRK</strong> does not accept responsibility for anyerrors or omissions in the supplied information and does not accept any consequential liability arisingfrom commercial decisions or actions resulting from them. Opinions presented in this report apply tothe site conditions and features as they existed at the time of <strong>SRK</strong>’s investigations, and thosereasonably foreseeable. These opinions do not necessarily apply to conditions and features thatmay arise after the date of this Report, about which <strong>SRK</strong> had no prior knowledge nor had theopportunity to evaluate.GOGP/LAKJ Report_April2013_19April2013 (1)_Final_Ludi_22052013 April 2013
<strong>SRK</strong> <strong>Consulting</strong>: 447493: <strong>Limpopo</strong> <strong>West</strong> GeochemPage xAcidificationAlkalinityNeutralising(NP)AquiferGlossary, Acronyms and AbbreviationsConcession areaDischargeDisposalDumpEffluentExposure pathwaysHazardous materialsLeachingPotentialOpen cast (open pit)miningOpen pitOreOre bodypHRiskRunoffThe decrease of acid neutralizing capacity in water, or base saturation in soil,caused by natural or anthropogenic processes. Acidification is exhibited as thelowering of pH, a process that can adversely affect aquatic life.A measure of water’s capacity to neutralize an acid. It indicates the presence ofcarbonates, bicarbonates and hydroxides, and less significantly, borates,silicates, phosphates and organic substances. It is expressed as an equivalentof calcium carbonate. The composition of alkalinity is affected by pH, mineralcomposition, temperature and ionic strength. However, alkalinity is normallyinterpreted as a function of carbonates, bicarbonates and hydroxides. The sumof these three components is called total alkalinity.The equivalent capacity of a solution to neutralize acids, either introduced intothe system or as a result of natural acid generating reactions.A rock layer or sequence that contains water and releases it in appreciableamounts.A grant of land or property especially by a government in return for services orfor a particular use.Release of potentially of water from mining or processing activity to thereceiving environment. This can either be contaminating or non-contaminating.Final placement of wastes; surplus chemicals, polluted soils and drumscontaining hazardous materials from removal actions or accident releases.A pile of broken waste rock or overburden on surface.An out flowing of water from a man-made structure, typically a processing plantThe physical route by which a contaminant moves from a source to a biologicalreceptor. A pathway may involve exchange among multiple media and mayinclude transformation of the contaminant.Materials in quantities that may harm persons, property or the environment.A chemical process for the extraction of valuable minerals from ore; also, anatural process by which ground waters dissolve minerals, thus leaving the rockwith a smaller proportion of some of the minerals than it contained originally.Also, a test methodology used to simulate natural processes that occur in wasterock.A method of extracting rock or minerals from the earth by their removal from anopen pit. The term is used to differentiate this form of mining from extractivemethods that require tunneling into the earth.A mine that is entirely on surface. Also referred to as open-cut or open-castmine.A mixture of ore minerals and gangue (valueless and undesirable material, suchas quartz in small quantities, in an ore) from which at least one of the oreminerals can be extracted at a profit or that is economically feasible for mining.A natural concentration of a valuable mineral or minerals that can be extractedand sold at a profit.The negative logarithm of the hydrogen ion activity, pH is an indication of theacidic or basic, i.e., alkaline, nature of water. Neutral water has a pH of seven.The potential hydrogen scale, measuring the acidity or alkalinity of a solution,from zero (highly acidic) to 14 (highly alkaline).A measure of the likelihood and the consequence severity with a hazardoccurring.The water from rain that flows over the land surface and is not absorbed into theground, instead flowing into streams or other surface waters or landdepressions.GOGP/LAKJ Report_April2013_19April2013 (1)_Final_Ludi_22052013 April 2013
<strong>SRK</strong> <strong>Consulting</strong>: 447493: <strong>Limpopo</strong> <strong>West</strong> GeochemPage xiStockpileStorm waterμS/cmABAAPARDCHPPDMRICPICP-OESIGSEIAEMPLoMMEAPMPRDANAGNAFNPNNPNPRPAFPLWMppmROMSPLPBroken ore heaped on the surface, pending treatment or shipment.Precipitation that accumulates in natural and/or constructed storage and stormwater systems during and immediately following a storm event and that is oftenrouted into drain systems in order to prevent flooding.Micro Siemens per centimetreAcid-base accountingAcid generation potentialAcid rock drainageCoal Handling and Preparation PlantDepartment of <strong>Mine</strong>ral ResourcesInductively coupled plasmaInductively coupled plasma optical emission spectrometryInstitute of Groundwater StudiesEnvironmental Impact AssessmentEnvironmental Management ProgrammeLife of <strong>Mine</strong>Mafutha Environmental Authorisation Programme<strong>Mine</strong>ral and Petroleum Resource ActNet acid generationNon Acid FormingAcid neutralizing potentialNet neutralization potentialNeutralising Potential RatioPotentially Acid Forming<strong>Proposed</strong> <strong>Limpopo</strong> <strong>West</strong> <strong>Mine</strong>Parts per millionRun of mineSynthetic precipitation leaching procedureGOGP/LAKJ Report_April2013_19April2013 (1)_Final_Ludi_22052013 April 2013
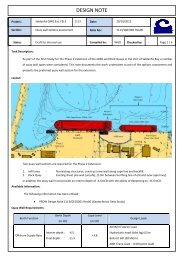
<strong>SRK</strong> <strong>Consulting</strong>: 447493: <strong>Limpopo</strong> <strong>West</strong> Geochem Page 121 IntroductionSasol Mining (Pty) Ltd (Sasol) has identified nine properties in Lephalale area for the development ofopen cast coal mine, referred to as the <strong>Proposed</strong> <strong>Limpopo</strong> <strong>West</strong> mine (PLWM).These propertiesformed part of a previous environmental study, Mafutha Environmental Authorisation Programme(MEAP), undertaken by <strong>SRK</strong>. An application for environmental authorization is required to securemining rights for the development of mining activities in these farms.In terms of the <strong>Mine</strong>ral and Petroleum Resources Development Act (No. 28 of 2002) (MPRDA), anEnvironmental Management Programme (EMP) is required to support an environmentalauthorisation decision that will be made by the Department of <strong>Mine</strong>ral Resources (DMR).Environmental Impact Assessment (EIA) Regulations developed in terms of the NationalEnvironmental Management Act (No. 107 of 1998) came into effect in April 20061. These weresucceeded by the June 2010 NEMA EIA Regulations 2. Under the above NEMA EIA Regulations, allmining related activities (e.g. internal roads, power lines, vegetation clearance, radio masts, etc.) thatare considered listed activities could require environmental authorisation from the NationalDepartment of Environmental Affairs (DEA) or provincial equivalent. Thus a separate application interms of NEMA could be required for all mines (new and existing, irrespective if they have anapproved EMP and/or mining right).This report documents the findings of the geochemical assessment and will be used to support theapplications for environmental authorisations as well as to support applications for a Water UseLicense and waste license.2 Project Description2.1 LocalityThe <strong>Limpopo</strong> <strong>West</strong> prospecting area is located approximately 45 km <strong>West</strong> of Lephalale, <strong>Limpopo</strong>province. The prospecting area covers nine identified farms and extends approximately 19 kmnorth/south and 12.5 km east/west, and falls under the jurisdiction of the Lephalale Municipalitywhich is located in the north western part of the Waterberg District in <strong>Limpopo</strong>. The municipality islocated approximately 40 km from the border of Botswana.The land use in the vicinity of the PLWM area includes mainly game farming, cattle grazing, powergeneration and coal mining, with the Grootegeluk situated 22 km of PLWM area. The location ofPLWM study area is presented in Figure 2-1.1 Listing Notices GN R386 and GN R387 dated April 2006.2 Listing Notices GN R544, GN R545 and GN R546 dated June 2010.GOGP/LAKJ Report_April2013_19April2013 (1)_Final_Ludi_22052013 April 2013
<strong>SRK</strong> <strong>Consulting</strong>: 447493: <strong>Limpopo</strong> <strong>West</strong> Geochem Page 13Figure 2-1: Location of <strong>Study</strong> AreaGOGP/LAKJ Report_April2013_19April2013 (1)_Final_Ludi_22052013 April 2013
<strong>SRK</strong> <strong>Consulting</strong>: 447493: <strong>Limpopo</strong> <strong>West</strong> Geochem Page 142.2 ClimateThe proposed project area is characterised by a dry climate, with temperatures reaching up to 40°Cand higher in summer with low rainfall.The long-term annual average rainfall is approximately 150 mm to 420 mm, occurring mostlybetween October and April, peaking in January (AGIS, 2002). The highest annual rainfallexperienced in the last 30 years was 762 mm in 1999/2000. The maximum monthly rainfall in the last30 years was 237 mm in February 2000. Groundwater recharge is estimated at less than10 mm/annum or less than 1.5% of the rainfall (Bester, 2009).Evaporation in the area is high, with the annual evaporation being approximately 2 281 mm. Thearea experiences average maximum temperatures of between 30°C and 36°C and averageminimum temperatures of between 7°C and 3°C. The wind pattern of the area is dominated by eastnorth-easterlyand north-easterly winds, as may be expected due to the continental high pressure.Winds are infrequently experienced from a westerly and south-easterly direction. East-north-easterlyand north-easterly winds increase in frequency during summer months, and the percentage of northeasterlywinds decreases in winter months.2.3 GeologyThe Sasol Mining prospecting right area is situated in the shallow portion of the Waterberg Coalfieldwhere coal-bearing strata of the Upper and Middle Ecca Group is developed. The Permo-Carboniferous Waterberg Coalfield, which forms part of the Karoo Sequence, extends approximately90 km EW and approximately 40 km NS near the north western border of South Africa and extendsinto Botswana.The prospecting rights area is further subdivided into three geographical areas, namely the Northern,Central and Southern areas. The subdivision is based on the faults that intersect the coal deposit.The Eenzaamheid Fault forms the southern boundary of the deposit, where the Karoo strata outcropon the strata of the Precambrian Waterberg Group. The northern boundary of the deposit is formedby the Zoetfontein Fault where Karoo strata are in contact with Archaean granites and gneisses.The stratigraphic unit containing the coal resource in the Waterberg Coalfield is known as theGrootegeluk Formation and correlates with the Volksrust Formation of the Ecca Group. The VryheidFormation contains five well-developed coal seams with characteristics similar to the coal seams inthe main Karoo Basin in Mpumalanga. The combined Grootegeluk and Vryheid Formationsrepresent a stratigraphic thickness of approximately 120 m, and are grouped into eleven coalbearingzones correlated across the entire coal deposit as shown Figure 2-2.GOGP/LAKJ Report_April2013_19April2013 (1)_Final_Ludi_22052013 April 2013
<strong>SRK</strong> <strong>Consulting</strong>: 447493: <strong>Limpopo</strong> <strong>West</strong> Geochem Page 15Figure 2-2: Generalised Stratigraphic Column of the Coal-bearing interval in the Waterbergcoalfield (After Snyman, 1998)GOGP/LAKJ Report_April2013_19April2013 (1)_Final_Ludi_22052013 April 2013
<strong>SRK</strong> <strong>Consulting</strong>: 447493: <strong>Limpopo</strong> <strong>West</strong> Geochem Page 162.4 Hydrology and HydrogeologyThe proposed project area is located within the greater <strong>Limpopo</strong> River Catchment, specifically withinthe A41E quaternary catchment of the <strong>Limpopo</strong> River and covers an area of 1 940 km 2 . This area ischaracterised by low rainfall and is drained by the <strong>Limpopo</strong> River, which is classified as nonperennial.The <strong>Limpopo</strong> River is located approximately 11 km north of the farm Welgelegen and runsin a north easterly direction, forming the northern border of South Africa. The Matladas River isapproximately 39 km to the west of the Welgelegen farm and is known to be used for irrigation andagriculture purposes (<strong>SRK</strong>, 2011). Generally, the site has a very gentle gradient (1:25) and slopes ina north easterly direction towards the <strong>Limpopo</strong> River, and a maximum elevation of 905 mamsl andminimum elevation of 845 mamsl.The hydrocensus conducted by <strong>SRK</strong> indicated that groundwater flow mimics the topography, flowingin a north westerly direction towards the <strong>Limpopo</strong> River (<strong>SRK</strong>, 2011). The major aquifer systemsgenerally associated with the coal fields consist of the following:Weathered zone aquifer: the geology is generally associated with soils and weathered rocks,the thickness of the layers ranges from 15 m to 20 m and recharge is mainly through rainfallinfiltration.Fractured zone aquifer: this aquifer occurs below the weathered zone and is a preferentialwater pathway mainly associated with geological structures such as faults, fractures and fissureswithin the rocks. Faults under tensional stresses are likely to be more permeable and goodaquifers. There is evidence of groundwater compartmentalisation indicated by chlorideconcentration differences on Eezaamheid and Daarby faults (<strong>SRK</strong>, 2011).The groundwater qualities previously assessed indicate sodium and chloride enrichment, whichreflect the geology of the area. Generally, the chemical signature of the groundwater in this areaexceeds irrigation guidelines for moderately tolerant crops, yet acceptable for livestock watering.Stable isotope analysis indicated that recharge is mainly from rainfall with minor evaporation prior toinfiltration.2.5 <strong>Mine</strong> PlanThree phases of mining are proposed by Sasol to mine the coal reserves at PLWM as presented inError! Reference source not found.. The mining will commence with a small mine and it isnvisaged that it will progress into a mega mine.The geochemical assessment focused on waste rock from the pit and discard from the plant. Wasterock will be deposited outside the pit on a demarcated overburden stockpile. Discard will bedeposited as discard stockpiles.Table 2-1: <strong>Proposed</strong> Phases of Mining at <strong>Limpopo</strong> <strong>West</strong><strong>Proposed</strong>PhasePhase 1Phase 2Size of<strong>Mine</strong>Small<strong>Mine</strong>Medium<strong>Mine</strong>Area/FarmPropertyDepth ofMining (m)Run of<strong>Mine</strong>Capacity(Mtpa)TotalCapacity(Mtpa)Welgelegen 40 - 50 0.4 0.4WelgelegenandGroenfontein40 - 50 16 16.4<strong>Mine</strong> ResiduedepositOverburden,Interburden, topsoiland beneficiationplant discards.Overburden andinterburden dumps toa maximum height of20 m.Overburden,Interburden, topsoiland beneficiationplant discards.Overburden andNotesOnly upperEcca zones tobe minedincludingzones 10 and11.Only upperEcca zones tobe minedzones 10 and11.GOGP/LAKJ Report_April2013_19April2013 (1)_Final_Ludi_22052013 April 2013
<strong>SRK</strong> <strong>Consulting</strong>: 447493: <strong>Limpopo</strong> <strong>West</strong> Geochem Page 17<strong>Proposed</strong>PhasePhase 3.1Phase 3.2Size of<strong>Mine</strong>Mega<strong>Mine</strong>Mega<strong>Mine</strong>Area/FarmPropertyWelgelegen,Groenfontein,Grootwater,GeelbekpanDuikerfontein,Gannavlake,RingbultDepth ofMining (m)Run of<strong>Mine</strong>Capacity(Mtpa)TotalCapacity(Mtpa)145 45 45145 45 90<strong>Mine</strong> Residuedepositinterburden dumps toa maximum height of30 m.Overburden,Interburden, topsoiland beneficiationplant discards.Overburden andinterburden dumps toa maximum height of120 m.Overburden,Interburden, topsoiland beneficiationplant discards.Overburden andinterburden dumps toa maximum height of120 m.NotesAll 11 coalseams to beminedAll 11 coalseams to beminedDuring Phase 1 and Phase 2, open pit mining method will be used. This method will consist ofdrilling, blasting, loading and hauling of waste rock and coal. The waste rocks are to be placedoutside the pit on a demarcated overburden stockpile areas, and the Run of <strong>Mine</strong> (ROM) coal is tobe delivered to the primary crushing circuit of the process plant. Phase 1 will make use of articulateddump trucks and hydraulic excavators together with auxiliary equipment for road maintenance, floorheight control and waste dump management. Phase 2 will mainly make use of large scaleequipment.The Mega <strong>Mine</strong> phases, Phase 3.1 and 3.2, which covers all nine farms in the complex, includingdeeper mining of the Phase 1 and 2 pit will make use of in-pit crushing approach. This approach ismainly used during these phases due to the large extent of the area to be mined. Four streams ofROM will be generated using five in pit crushing and conveying systems.Based on the understanding of the geological material collected during the Sasol Mafutha Project(<strong>SRK</strong>, 2011) and previous studies in the Waterberg Coalfield (Bester and Vermeulen, 2010) thetypes of material that will be disturbed, exposed and/or deposited during the mining is presented inTable 2-2.Table 2-2: Types of materials expected from the mining of coalSource Material Type DescriptionROM StockpileDiscardOverburdenInterburdenOpen pit and In pitcrushingCoalCoal processing residuesWeathered material consisting ofconglomerate, sand and mudstoneMudstone, coal shale, coal, sandstoneMudstone, coal shale, coal, sandstoneRolling stockpile consisting of coalmaterialResidues material from coalprocessing that be disposed onto adiscard dumpResidue material that will make upthe overburden waste stockpileResidue material that will make upinterburden waste stockpileThe material that will be exposed inthe walls and base of the pit. Similarto those constituting the from theoverburden, interburden and coalstockpiles.GOGP/LAKJ Report_April2013_19April2013 (1)_Final_Ludi_22052013 April 2013
<strong>SRK</strong> <strong>Consulting</strong>: 447493: <strong>Limpopo</strong> <strong>West</strong> Geochem Page 182.6 ProcessingThe objective of the coal beneficiation for the PLWM is to produce two types of products during thethree phases of mining; a prime export product and a middlings power generation product. Theprocesses are classified in terms of the proposed mining phases and are as follows:Phase 1 - a coal handling and preparation plant (CHPP) with a maximum capacity of 400 ktpaROM coal for a period limited to 10 years. This process will include a two-stage dense mediumseparation washing plant, a fines treatment and a slime disposal plant.Phase 2 - expansion (16 Mtpa) to a large scale operation most probably after 2018, with theobjective to supply a new coal-fired power station. The type of products to be generated will besimilar to those in Phase 1. This process will require three 800 tph DMS modules. Phase 3 - expansion from 45 Mtpa to 100 Mtpa and production will only commence 20 to 30years after the Mining Rights have been awarded.During full production of Phase 3, it is expected that there will be a total of thirteen multi-wash plantmodules. A module consists of a screening plant, high gravity DMS, low gravity DMS and a DMS forPCI product. There will be seven single wash modules. Each module is comprised of a screeningplant and a high gravity DMS. Arranging the plant in modules reduces inefficiency caused by feedsegregation and also reduces the complexity of the process. There will also be low-ash coalstreams that require screening only.3 Objectives and Work program3.1 ObjectivesThe key objectives of the geochemical characterisation for the PLWM were to:Review available geochemical information on the geological materials that will be disturbed bymining operations at the proposed PLWM;Collate and interpret the available data to assess the Acid Rock Drainage (ARD) and MetalLeaching (ML) potential of the material; andTo provide geochemical input to support the application for environmental authorisation for aWater Use License and waste license.3.2 Work ProgramTo address the above objectives, the scope of the study included:A desk study to review available geochemical characterisation information on geologicalmaterials that will be disturbed by mining operations at PLWM including:Data analysis and interpretation of data from the information review; andReport writing to document the findings of the study.It should be noted that due to the unavailability of rock cores, no geochemical sampling and analysiswas conducted by <strong>SRK</strong> in 2013 to verify the reported geochemical information. Reliance was madeon previous geochemical sampling conducted bu <strong>SRK</strong> and other for the Sasol Mafutha assessment.4 Assumptions and LimitationsThe key assumptions and limitations of this assessment are as follows:<strong>SRK</strong> was informed by the Sasol Geologist, that core had not been preserved and coreavailability was limited across the proposed mining area. Therefore sample details and analyticalresults were obtained from IGS, and were used for the geochemical interpretation. <strong>SRK</strong>assumes that the integrity of these samples were not compromised by any means and that thesamples are representative of the coal and overburden lithologies that will be mined during theproposed project.GOGP/LAKJ Report_April2013_19April2013 (1)_Final_Ludi_22052013 April 2013
<strong>SRK</strong> <strong>Consulting</strong>: 447493: <strong>Limpopo</strong> <strong>West</strong> Geochem Page 19As mine design including that of the waste rock facilities is still underway, the physical propertiesof the waste rock facility (mass, height, footprint) were not considered during this assessment.The analytical results that were used to assess geochemical properties are those that weremade available by IGS and represent waste material that will comprise the waste rock facilities.The data used in this study was obtained from composited samples. A major limitation withcompositing is that it may mask variability in geochemical properties of the sample. This mayoccur through the loss of discrete information about the sample (individual lithological units) andthrough the potential for dilution of contaminants (pyrite hot spots) in a sample withuncontaminated material.Although no discard and rock samples were available for testing, analogue information obtainedfrom Grootegeluk mine and neighbouring areas are used in this report. The analogueinformation was assumed to be representative of the PLWM area.Data from the geochemical assessment undertaken by <strong>SRK</strong> (2011) to support the Sasol MafuthaEIA was also used as analogue data to supplement knowledge gap from the current study.Information on kinetic test was unavailable. While static test data like Acid Base Accounting(ABA) provide information on the composition of the sample, site specific kinetic information isrequired to show how a material with that composition will react over time.The acid-base accounting (ABA) method is only indicative and should be used with caution as:o most natural neutralising minerals are not capable of neutralising pH above a valueof 6;ooothe total sulfur to calcium carbonate conversion factor is theoretical and based ongeochemical assumptions that depend on the acid-generating conditions;the hydroxide titration (to measure acidity) contains a level of uncertainty as someminerals will re-precipitate at varying rates, which affects the mass of hydroxideneeded to reach pH 7;the material tested is ground to 0.8 mm and therefore the exposed surface area ismuch greater than would occur once the material had been deposited;Acid-Base Accounting assumes that all acid production is attributable to iron disulphide minerals(chiefly pyrite) and that no acid is produced by sulphate or organic sulphur forms.5 Geochemical CharacterisationThe following sections discuss the program that was followed to characterise the ARD and MLpotential of the geological materials associated with coal mining at PLWM.5.1 Approach and MethodologyThe approach adopted was based on the generic methodology used for drainage prediction (DWAFBest Practice Guideline-G4, 2008) and consisted of the following tasks:Review of relevant information to identify the type of minerals and geological successionassociated with the coal seams and thus guide the sampling exercise. In this case, coal isassociated with clay and silicates (predominantly quartz and mica minerals).Identification of geological succession and hence of potentially reactive lithologies that mightpose environmental risks,Collection by IGS, of drilled rock cores including coal and water samples from identified reactivelithologies.The selection of analytical methods to evaluate the potential of these geological materials togenerate ARD and metal leaching.GOGP/LAKJ Report_April2013_19April2013 (1)_Final_Ludi_22052013 April 2013
<strong>SRK</strong> <strong>Consulting</strong>: 447493: <strong>Limpopo</strong> <strong>West</strong> Geochem Page 205.1.1 Reviewed ReportsGeochemical information was obtained from the following sources: EIA Report, Sasol Mafutha Pre-feasibility Project, 2009; Sasol Mafutha Geochemical Characterisation Report (<strong>SRK</strong>, 2011); Groundwater Resource Assessment of the Waterberg Coal Reserves Report (IGS, 2009);5.2 SamplingHatch <strong>Limpopo</strong> <strong>West</strong> <strong>Mine</strong> <strong>Concept</strong> <strong>Study</strong> Report, andSasol geological database consisting of core log profiling sheets.Due to the lack of preservation of core samples, and unavailability of rock cores for <strong>SRK</strong> to sample,recourse has been made to data collected during the IGS investigations which undertook a samplingprogram within PLWM lease area. <strong>SRK</strong> understands from the IGS investigation, that two explorationboreholes samples comprise overburden lithologies from the lease area, with the other samplescollected by the IGS on the lease area representing coal seams, as described in Table 5-1. The twoboreholes which <strong>SRK</strong> understands to represent overburden are however, not included in thegeological log information provided by Sasol to <strong>SRK</strong>, therefore, the exact lithologies sampled asoverburden could not be confirmed.Table 5-1: Summary of Exploration Boreholes sampled by IGSBorehole IDFarmIGS SampleIDSample Type *Depth Range(m)Sampled Zone No.W228030 Welgelegen W overburden 6.26 - 24.72samples takenaccording to depthsG250040 Groenfontein WGH overburden76.24 - samples taken147.90 according to depthsCoal and 29.17 -G218016 Grootwater WGDoverburden 145.64 7,6,5,4,3,2G226006 Geelbekpan WGACoal andoverburden - 11,10,9,8,7,6,5,4,3,2G226010 Geelbekpan WGBCoal andoverburden60.97 -127.63 11,10,9,8,7,6,5,4,3,2G226014 Geelbekpan WGCCoal andoverburden - 11,10,9,8,7,6,5,4,3,2G226020 Geelbekpan WGGCoal andoverburden - 10R 303 015 Ringbult WRACoal andoverburden - 1, 2, 3, 4, 5Notes: *Coal and overburden assumed due limited information on depth and lithological unitsThe samples were crushed and composite were prepared for individual samples, for Welgelegenand Groenfontein farms the samples were composited for every 1 m of core intersection. For thesamples collected from Grootwater, Geelbekpan and Ringbult farms, the composite were preparedbased on the coal zones as included in the section above. The details pertaining to the number ofsamples and static geochemical testing undertaken on the samples by IGS is presented in Table5-2. Although large number of samples was collected, the lack of information on key lithological unitscompromised the representativity of the samples.GOGP/LAKJ Report_April2013_19April2013 (1)_Final_Ludi_22052013 April 2013
<strong>SRK</strong> <strong>Consulting</strong>: 447493: <strong>Limpopo</strong> <strong>West</strong> Geochem Page 21Table 5-2: Geochemical Testwork by IGSBorehole ID Number of samples TestworkW228030 33G250040 38G218016 23G226010G226006G22602078G226014R303015 7Acid Base Accounting,Net acid Generation,Contact leach test,Sulfuric acid leach testGOGP/LAKJ Report_April2013_19April2013 (1)_Final_Ludi_22052013 April 2013
<strong>SRK</strong> <strong>Consulting</strong>: 447493: <strong>Limpopo</strong> <strong>West</strong> Geochem Page 22Figure 5-1: Locality of Exploration BoreholesGOGP/LAKJ Report_April2013_19April2013 (1)_Final_Ludi_22052013 April 2013
<strong>SRK</strong> <strong>Consulting</strong>: 447493: <strong>Limpopo</strong> <strong>West</strong> Geochem Page 235.3 Data analysis and interpretation5.3.1 Acid Base AccountingAcid Base Accounting (ABA) testing was undertaken using the Modified Sobek method. The testmethod identifies the potential for the tested material to generate net acidity by determining the acidgenerating and neutralizing potentials and then calculating parameters from these two values whichindicate net acid generating potential.The analysis included the determination of initial pH, final NAG pH and determination of reactivesulfate (kg/t) using hydrogen peroxide oxidation. This approach used by IGS assumes that thesulfate produced during complete oxidation is representative of the sulfuric acid. From the value ofthe sulfate using hydrogen peroxide it was then possible to determine the acid generating potential(AP) of each sample as follows:( ) ⁄The Neutralization Potential (NP) of each sample was determined by reaction of the sample withexcess sulfuric acid over 24 hours and subsequent back titration to pH 8.3 using sodium hydroxide.The Net Neutralizing Potential (NNP) is calculated as the difference between Neutralizing Potential(NP) and Acid Potential (AP) and the Net Potential Ratio (NPR) are calculated for each sample asfollows:( )( )The NNP provide a balance between the acid generating mineral phases and acid neutralisingminerals, and allows the classification of the samples either as potentially acid consuming or acidproducing.The MEND Prediction Manual for Drainage chemistry (W.A Price, 2009) and the Global Acid RockDrainage Guideline (INAP, 2009) have been used as criteria to assess the acid generating potentialof the geological materials. The methodology that has been used in these guidelines advocatebasing AP on:The oxidation of sulfide minerals,The dissolution of acidic sulfate minerals, such as jarosite, alunite and melanterite,The hydrolysis of metals from sulfide and sulfate minerals.These guidelines emphasise that there is no minimum concentration of sulfide responsible for acidgeneration, and base the acid drainage assessment on NPR as presented in Table 5-3.Table 5-3: ABA Criteria based on NPR (W.A Price, 2009 and INAP, 2009)Criteria NNP (kg CaCO 3 eq/t) NPRPotentially Acid Forming (PAF) NNP< -20 NPR < 1Non Acid Forming (NAF) NNP> +20 NPR > 3Area of Uncertainty (UNC) -20 < NNP < +20 1 < NPR < 3The Acid Potential of the samples have been calculated for both Open and Closed systems. Theoxidation of pyrite in the open system results in carbon dioxide being exsolve into the atmosphere. Inthe open system, the acidity produced from 1 mole of pyrite (FeS2) is neutralised by 2 moles ofCaCO 3 resulting in a mass ratio of 1.0 g pyrite: 3.125 g calcite. The following reaction illustrates theopen system:( )GOGP/LAKJ Report_April2013_19April2013 (1)_Final_Ludi_22052013 April 2013
Acid Generating Potential kg/t CaCO3<strong>SRK</strong> <strong>Consulting</strong>: 447493: <strong>Limpopo</strong> <strong>West</strong> Geochem Page 24The Closed Systems depicts acid generating potential of a certain material whereby carbon dioxidedissolves in the water resulting in the formation of carbonic acid (H2CO3) which in turns reacts withCaCO 3 to form HCO3. In this reaction, acidity produced by 1 mole of pyrite is neutralised by 4 molesof CaCO 3 resulting in a mass ratio of 1.0 g pyrite: 6.325 g calcite. The following reaction illustratesthe closed system:( )As the samples tested represent composites of a variety of lithologies, it is assumed that thematerials being characterised represent a mixture of ore (coal seams) and waste (overburden andinterburden). The summary of the ABA results received from IGS for the waste rock and coalsamples is included in Appendix B.Neutralising potential (NP) in the samples varies widely, ranging from 0.06 kg CaCO 3 eq/t to 132 kgCaCO 3 eq/t. The variation might be attributed to compositing approach taken by IGS which resultedin a wide variety of matrix being mixed. The ratio between NP and AP represented by the NPRvalues is presented in Figure 5-2. It is evident that some of the samples (34%) plot above the 1:1 line(red) indicating that these samples have the potential to generate acidity. A considerable portion ofthe samples plot below the 4:1 line (green), indicating that these samples have some neutralisationpotential available.Previous studies on the mineralogy of the samples in the vicinity the LPWM project area (<strong>SRK</strong>, 2011and Bester et. al, 2009), indicated that minerals such as calcite (CaCO 3 ) and ankerite (Ca (Fe, Mg,Mn) (CO 3 ) 2 ) are present in most of the lithologies and might therefore contribute to the NP.400.00350.00300.00OPEN SYSTEM250.00CLOSEDSYSTEM200.00150.001:1 Above thisacidification islikely2:1100.004:1 Below thisacidificationunlikely50.000.000.00 50.00 100.00 150.00 200.00 250.00 300.00 350.00 400.00Neutralising Potential kg/t CaCO3Figure 5-2: AP vs. NP (NPR)GOGP/LAKJ Report_April2013_19April2013 (1)_Final_Ludi_22052013 April 2013
<strong>SRK</strong> <strong>Consulting</strong>: 447493: <strong>Limpopo</strong> <strong>West</strong> Geochem Page 255.3.2 NAG TestThe initial paste pH value of the pulverised waste rock and coal samples was measured during ABAtestwork. After completion of the oxidation using hydrogen peroxide, a final pH was measured. Theobjective of this approach is to provide acid generation potential on complete oxidation of sulphidesin the sample. An initial acidic pH indicates that the sample has undergone oxidation prior to testingand might potentially result in acid rock drainage.The initial and final pH is plotted against the Nett Neutralisation Potential (NNP) expressed in kgCaCO 3 equivalent/tonne presented in Figure 5-3.10.09.08.07.06.05.04.03.02.01.00.0-400 -350 -300 -250 -200 -150 -100 -50 0 50 100 150 200NNP in kg/tonne CaCO3Initial pHFinal pHFigure 5-3: Open System Nett Neutralisation Potential (NNP) vs. pH (initial and final)The majority of the samples, approximately 62%, plot in the uncertainty field (- 20 < NNP < +20) ofthe graph, with some of the samples plotting in the negative area (NNP < -20) of the graph whichimply that some of the samples collected from coal zone 2, 3, 4, 5, 6, 7 and two hot spots inWelgelegen (19 to 20m) and Groenfontein samples (79 to 80m) have potential to generate acidity interms of NNP. It is evident that most samples commenced with an alkaline pH condition afteroxidation, the final pH of most samples turned acidic which indicates that these samples are likely toproduce acidity. On the positive side of the graph, the pH of most of the Welegegen samples, at adepth ranging from 14 to 25m, remained alkaline probably indicating excess neutralising minerals.Previous mineralogical study (<strong>SRK</strong>, 2011 and Bester, 2009) indicated the presence of minerals suchas ankerite and calcite that might participate in acid neutralisation.Summary of ABA and NAG TestsThe following inferences can be made from the results:Paste pH, NAG pH and ABA indicate that the geological materials from Groenfontein,Geelbekpan are potentially acid generating.The rock cores sampled from the Welgelegen farm were collected from a shallow depth rangingfrom 8.0 m to 24.72 m. The final pH (NAG) of most of these samples have not turned acidicafter oxidation and have remained relatively alkaline to circum neutral, indicating low risk of acidgeneration. Hot spots of PAF materials at 18 m, 19 m, 22 m and 24 m were also assessed fromthe final pH of these samples which turned acidic. The NPR values were mostly greater than 3GOGP/LAKJ Report_April2013_19April2013 (1)_Final_Ludi_22052013 April 2013
<strong>SRK</strong> <strong>Consulting</strong>: 447493: <strong>Limpopo</strong> <strong>West</strong> Geochem Page 26and relatively coincide with the final alkaline to circumneutral pH of most samples. Thesesamples have therefore been assessed as NAF.The samples from Groenfontein borehole were sampled at depth, ranging from 76.24 m to412.3 m. These samples indicated a high likelihood of acid generation based on the NAG pHvalues. The NPR is less than 1 indicating that the samples are PAF. The samples from Grootwater, Geelbekpan and Ringbult were all sampled according to the 11zones of coal bearing sequence, with zones 5 to 11 occurring in the Grootegeluk Formationwhich comprises mainly alternating mudstone and thin coal seams (Bester, 2009). The samplesfrom zones 5 to 11 have NPR values less than 1 indicating that these samples are PAF. Basedon the final pH, samples from zone 1 to 4 are PAF although some of the samples tend toindicate uncertainties in classification.GOGP/LAKJ Report_April2013_19April2013 (1)_Final_Ludi_22052013 April 2013
<strong>SRK</strong> <strong>Consulting</strong>: 447493: <strong>Limpopo</strong> <strong>West</strong> Geochem Page 275.3.3 Metal LeachibilitySulfuric Acid LeachThe Institute of Groundwater Studies (IGS) analysed the geochemical behaviour of the wastematerials under acid conditions by adding weak sulfuric acid to the sampled material. A solid to liquidratio of 1:10 was used. The samples were then left to stand for 24 hours prior to the metalquantification by ICP-OES. A summary of the results of the sulfuric acid leach test is presented inAppendix B.The results show high concentrations of metals and metalloids in the leachate. The elevatedconcentrations of these metals indicate that they will be mobilised under acid rock drainageconditions. The leachate pH was plotted against the sum of metals concentrations (Al, Cu, Fe, Mn,Ni, Sr and Zn) in a Ficklin diagram presented in Figure 5-4.Figure 5-4: Ficklin metal concentrations against sulfuric acid leach pHIt is evident from the plot that the concentrations of metals leaching from the geological materials issignificantly elevated, indicating that high concentrations of metals might potentially be mobilisingfrom the samples after oxidation has occurred. This implies that the metals which include Al, Cu, Fe,Mn, Ni and Zn might potentially mobilise in elevated concentrations. Although these results indicateworst case scenario (acidic conditions), a high concentration of a particular element does, however,not necessarily imply that this element will be mobilized in significant concentrations that mightimpact on the surrounding environment.GOGP/LAKJ Report_April2013_19April2013 (1)_Final_Ludi_22052013 April 2013
<strong>SRK</strong> <strong>Consulting</strong>: 447493: <strong>Limpopo</strong> <strong>West</strong> Geochem Page 28Contact LeachVarious forms of contact leach test are used to simulate the pore water composition that will seepfrom residues stockpiles. In the mining industry the Synthetic Precipitation Leaching Procedure(SPLP) at pH 4.2 and solid: liquid ratio 1:20 has been widely used where acid rain is prevalent orwhere the residues are considered to be acid producing. Contact leach tests have been widely usedby many recent investigators as opposed to SPLP due to the following reasons:The SPLP leach using the specified 1:20 solid: liquid ratio is likely to over-dilute the simulatedpore water in all but the wettest areas, leading to under-estimation of contaminantconcentrations;The pH 4.2 used commonly in the SPLP procedure may be more aggressive in most cases thanwould be experienced in the field, leading to over-estimation of certain contaminants;Distilled/deionized water extract at a higher solid: liquid ratio than 1:20 is considered to provide amore pore water quality result.The distilled water shake flask test (ASTM D3987) was used to leach raw material samples. Thesamples were shaken for 24 hours at a solid to liquid ratio of 1:10. A summary of the distilled waterleach test are presented in Appendix B.The results indicated that the leachate ranged from slightly acidic to alkaline (pH 5.0 to 8.6). Themajor constituents that contribute to salinity include Ca, Mg, Na, K and SO 4. Sulphate had thehighest concentration (58 to 6 640 mg/l) in the leachate of all samples, with 50% of the samplesexceeding the SANS 241:2011 guidelines.GOGP/LAKJ Report_April2013_19April2013 (1)_Final_Ludi_22052013 April 2013
Calcium+Magnesium to Sulfate Ratio<strong>SRK</strong> <strong>Consulting</strong>: 447493: <strong>Limpopo</strong> <strong>West</strong> Geochem Page 29The leach data have been used to plot pH versus the ratio of Ca+Mg: SO 4 in milli-equivalent/l. Thisratio is plotted to provide an indication as to whether pH is controlled by the dissolution of carbonatesor by acidity generated from the oxidation of sulfides. Generally a ratio above 1 indicates thatcarbonate dissolution is controlling pH, while a ratio below 1 indicates that sulfide oxidation iscontrolling the pH.9.08.07.06.05.04.03.02.01.00.04.0 5.0 6.0 7.0 8.0 9.0 10.0pHGroenfontein Grootwater Geelbekpan Ringbult Welgelegen Linear (Series6)Figure 5-5: Ratio of the sum of Calcium and Magnesium to Sulfate as meq/lFor the material sampled by IGS, which is assumed to be composite of the various materials, it isevident that some of the sampled materials (58%) have the ratio of Ca + Mg to SO 4 above 1, whichindicates that carbonates are controlling the pH and not pyrite oxidation. The rest of the samples(42%) have ratios of less than 1 indicating that sulfide oxidation controls the pH of these sampleswhich might potentially be attributed to the presence of coal associated lithologies. This supports thepaste pH values, however, the ABA findings indicate that a significant portion of the sample haveuncertain acid generating potential.The sum of the metal concentrations were plotted against the deionised leach pH in a Ficklindiagram to assess whether these samples have the potential to mobilise metals at concentrationsthat could impact groundwater and surface water. The Ficklin diagram is presented in Figure 5-6.GOGP/LAKJ Report_April2013_19April2013 (1)_Final_Ludi_22052013 April 2013
<strong>SRK</strong> <strong>Consulting</strong>: 447493: <strong>Limpopo</strong> <strong>West</strong> Geochem Page 30Figure 5-6: Ficklin metal concentrations against contact leach pHAt circumneutral to alkaline pH condition, the mobility of metals is a limited. However, the followingmetals are likely to be mobilised under neutral to alkaline conditions Al, Fe, Sr and to some extentZn.5.3.4 Pit WaterMonitoring of the existing pit lake quality of the Bulk Sample pit which is located in the central area iscurrently undertaken by Sasol on a monthly basis. were assumed to be representative of the pit lakewater quality periodically filling the exiting pit The monitoring l results were provided to <strong>SRK</strong> by Sasoland are presented in Table 6 4. The highlighted cells indicating exceedance relative to SANS241:2011 water quality guidelines. The following inferences were drawn from Table 6 4:The pit water is neutral to slightly alkaline,Alkalinity ranges from 109 mg/l to 543 mg/l,TDS ranges from 396 mg/l to 1 404mg/l, andAluminium, nitrite, Sodium and TDS exceed the SANS 241:2011 water quality guidelinesGOGP/LAKJ Report_April2013_19April2013 (1)_Final_Ludi_22052013 April 2013
<strong>SRK</strong> <strong>Consulting</strong>: 447493: <strong>Limpopo</strong> <strong>West</strong> Geochem Page 31Table 5-4: Pit Water Monitoring DataSite ID Date pH EC TDS Ca Mg Na K Alkalinity Cl SO 4 NO 2 F Al Fe MnSANS241:20115.9-9.7 - 1200 NS NS 200 NS NS 300 500 10 1.5 0.30 2.00 0.50PIT 30/11/2009 7.9 183 1172 50 33 211 9.2 289 283 123 -0.20 3.3 0.28 -0.10 -0.10PIT 01/12/2009 7.6 185 - 69 30 287 16 370 294 54 - 3.2 0.02 0.02 0.03PIT 01/12/2009 7.6 185 - 69 30 287 16 370 294 54 - 3.2 0.02 0.02 0.03PIT 12/01/2010 7.5 194 1278 57 38 201 13 321 298 45 15 2.3 0.21 -0.10 -0.10PIT 14/01/2010 7.3 216 1404 66 48 212 8.1 543 300 45 9.0 0.54 0.19 -0.10 0.13PIT 20/01/2010 7.6 204132671 43 209 7.3 412 310 35 25 1.1-0.10 -0.10 -0.10PIT 01/02/2010 8.0 180 - 54 31 235 22 219 310 - - 1.3 0.00 0.01 0.01PIT 03/02/2010 7.9 167 1084 47 40 195 27 264 312 87 8.9 1.5 0.17 0.22 -0.10PIT 22/02/2010 8.1 178PIT 10/03/2010 7.5 185PIT 25/03/2010 7.8 1671158977108844 32 235 10 263 341 138 9.0 1.346 31 263 8.9 290 322 124 11 1.350 31 231 7.0 244 332 82 8.8 0.44-0.10 -0.10 -0.10-0.10 -0.10 -0.10-0.10 -0.10 -0.10PIT 01/04/2010 8.0 180 - 54 31 235 22 219 310 153 - 1.3 0.00 0.01 0.01PIT 01/04/2010 7.8 159 988 53 29 219 9.5 226 308 120 9.3 1.3 0.14 -0.10 -0.10PIT 09/04/2010 7.7 196 1273 99 44 244 5.6 336 303 211 33 1.1 0.95 0.18 0.11PIT 09/04/2010 8.0 158 1026 64 33 224 5.5 234 308 130 14 1.6 0.15 -0.10 -0.10PIT 24/04/2010 8.0 169103162 33 206 11 263 254 163 18 1.0-0.10 -0.10 -0.10PIT 14/05/2010 7.7 170 982 76 36 178 8.7 272 257 133 22 0.9 1.3 0.17 -0.10PIT 01/06/2010 7.2 102 - 35 13 160 4.2 320 116 43 -0.10 0.8 0.01 0.31 0.04PIT 01/07/2010 7.2 102 - 35 13 160 320 116 43 - 0.9 0.01 0.31 0.04PIT 12/08/2010 8.1 159 1026 49 34 182 7.5 311 258 103 9.1 1.2 0.53 -0.10 -0.10PIT 13/08/2010 8.1 160 1038 54 35 281 7.7 313 256 268 9.0 1.3 0.47 -0.10 -0.10GOGP/LAKJ Report_April2013_19April2013 (1)_Final_Ludi_22052013 April 2013
<strong>SRK</strong> <strong>Consulting</strong>: 447493: <strong>Limpopo</strong> <strong>West</strong> Geochem Page 32Site ID Date pH EC TDS Ca Mg Na K Alkalinity Cl SO 4 NO 2 F Al Fe MnSANS241:20115.9-9.7 - 1200 NS NS 200 NS NS 300 500 10 1.5 0.30 2.00 0.50PIT 01/11/2010 00:00 8.1 180 - 38 28 280 13 334 308 99 - 1.0 0.02 0.05 0.02PIT 19/01/2011 12:00 8.1 177 1152 57 37 254 10 322 317 152 11 1.2 0.13 -0.10 -0.10PIT 14/04/2011 12:00 7.8 170 1102 69 36 261 15 380 295 188 11 1.8 0.11 -0.10 -0.10PIT 15/04/2011 12:00 8.0 179116262 37 264 15 389 303 195 9.2 1.6-0.10 0.29 -0.10PIT 28/04/2011 12:00 7.5 164 876 58 29 204 11 251 254 163 12 1.6 0.12 -0.10 -0.10PIT 28/04/2011 12:00 7.9 175 726 62 34 201 11 319 294 87 9.2 1.6 0.11 -0.10 -0.10PIT 28/04/2011 12:00 8.0 177 924 70 35 206 11 320 298 100 8.7 1.9 0.11 -0.10 -0.10PIT 27/06/2011 10:07 7.8 172 1119 40 51 144 17 318 240 118 9.7 0.60 0.56 -0.10 -0.10PIT 29/08/2011 10:30 7.9 171 1110 76 36 209 11 324 272 204 8.7 1.3 0.2 0.22 -0.10PIT 07/11/2011 12:00 8.1 169109970 38 262 13 399 284 196 10.0 1.7-0.10 -0.10 -0.10PIT 09/01/2012 15:16 8.3 175113938 34 272 15 274 274 235 9.3 1.2-0.10 -0.10 -0.10PIT 20/02/2012 13:00 8.3 169109843 36 292 13 305 308 286 9.2 2.5-0.10 -0.10 -0.10PIT 02/04/2012 12:00 8.4 174Notes: NS – Not stated113245 37 286 18 284 312 250 10.0 1.2-0.10 -0.10 -0.10GOGP/LAKJ Report_April2013_19April2013 (1)_Final_Ludi_22052013 April 2013
<strong>SRK</strong> <strong>Consulting</strong>: 447493: <strong>Limpopo</strong> <strong>West</strong> Geochem Page 3312.0Calcium+Magnesium:Sulfate Ratio10.08.06.04.02.00.07.0 7.2 7.4 7.6 7.8 8.0 8.2 8.4pHPITLinear (Series2)Figure 5-7: Ratio of the sum of Calcium and Magnesium to Sulfate as meq/lThe ratio of the sum of calcium and magnesium to sulfate is presented in Figure 5-7. The ratio of allthe samples are all above 1, indicating that carbonate dissolution is probably controlling pH. Theseresults indicate that the existing pit water quality is controlled by the influx of groundwater and wallseepage rather than by the oxidation of sulfide minerals.GOGP/LAKJ Report_April2013_19April2013 (1)_Final_Ludi_22052013 April 2013
<strong>SRK</strong> <strong>Consulting</strong>: 447493: <strong>Limpopo</strong> <strong>West</strong> Geochem Page 345.4 Comparison with Previous StudiesTwo geochemical studies have been undertaken in the vicinity of the project area. One significantinvestigation was the Groundwater Resources Assessment of the Waterberg Coal Reserves whichwas undertaken as a component of a Phase 1 WRC study by the IGS in 2009. A second study wasundertaken by <strong>SRK</strong> in 2011 to support the Environmental Impact Assessment (EIA) for the SasolMafutha project.5.4.1 IGS <strong>Study</strong> (2009) – Groundwater Resource Assessment of the Waterberg CoalReservesAs part of the wider Waterberg Coalfield study undertaken by WRC, IGS undertook a scoping levelstudy to consolidate the following information:the existing information on the different aquifers in the study area;the pre-mining water quantity and quality of water resources associated with the Waterberg coalfield;the acid generating potential of the geology in the study area to identify potential lithologies thatmight generate acidity upon oxidation; andthe impact of additional mine in the area.The main objective of the study was to determine the lithological units within the Waterberg CoalFields which were prone to either acid generation or acid neutralisation.The study area is located to the west of Lephalale and close to the Botswana border. It stretchesfrom the town of Lephalale in the east, to just west of the town of Steenbokpan in the west and to theborder of Botswana in the north.A total of 84 samples were collected and analysed. The material type collected varied from coresamples to chip samples. In addition, two samples from the processing plant at Grootegeluk <strong>Mine</strong>and one sample from the sandstone layer located below the coal succession were collected.Laboratory analyses included ABA testing, NAG testing and mineralogy by XRD.The findings of the ABA for the samples collected from the north/western site of the Waterberg areaindicated that some of the samples have high likelihood to generate acidity upon oxidation and someindicate buffering potential which is probably associated to the calcite content (2-10%).In the south eastern areas, one sample was collected at a depth of 160 m representing the full coalsuccession and three additional samples were collected to represent weathered lithology. Thesamples from the south eastern site surrounding the Grootegeluk mine indicated that acid minedrainage will be produced upon oxidation in some of the samples, although there is also somebuffering potential present within some of these samples.From the Vryheid Formation, chips samples were collected from the northern area, at depth rangingfrom 1 m to 14 m. Most of these samples indicated the presence of neutralisation potential. Thesandstone samples located beneath Coal zone 2 indicated acid generating potential.The discard samples from two beneficiation plant at Grootgeluk mine indicated a high potential togenerate acidity with negative NNP for both the closed and open systems. The NPR values of allthese samples were less than one indicating acid generating potential.Base on the findings of the Waterberg coal fields study, it can be concluded that the discards fromthe Waterberg area might potentially produce acidity upon oxidation. This finding was furtherconfirmed by the acidic effluent decanting from the discard dumps at the Grootegeluk mine. Asummary of the findings is presented in Table 5-5.GOGP/LAKJ Report_April2013_19April2013 (1)_Final_Ludi_22052013 April 2013
<strong>SRK</strong> <strong>Consulting</strong>: 447493: <strong>Limpopo</strong> <strong>West</strong> Geochem Page 35Table 5-5: Summary of Findings – Acid Rock Drainage Assessment by IGSAreasNorth<strong>West</strong>ernSouthEasternNorthernAreaGeologyFull succession of geology and coalFull succession of geology and coalWeathered Area down to Middle EccaWeathered Area down to Middle EccaARDpotentialPAFNAFPAFNAFPAFPAFNAFBelow Coal Zone 2 PAF SandstoneGrootegeluk Discard from Grootegeluk Plant PAF DiscardPotential ProblematicLayers/MaterialAlternating layers of Mudstoneand Shale interbedded with coalAlternating layers of Mudstoneand Shale interbedded with coalAdditional Sampling to identifyspecific layerAdditional Sampling to identifyspecific layerGenerally this study concluded that the samples from the full succession of geology (NW and SEareas) and coal indicated acid and neutral generating potential, with the PAF material limited to adepth of between 50 m and 80 m. This depth corresponds to the pyrite bearing lithologies. Thesamples collected from the weathered areas (SE and N) are both PAF and NAF. Additional samplingis required to confirm specific PAF lithologies. The sandstone collected coal zone 2 and the discardsamples have both been classified as PAF.5.4.2 Sasol Mafutha (<strong>SRK</strong>, 2011)As part of the Environmental Impact Assessment (EIA) undertaken by <strong>SRK</strong>, an assessment wascarried out to determine the geochemical characteristics of geological materials that will be exposed,disturbed and/or deposited by mining operations at Sasol Mafutha.During this assessment, a total of 15 composites were analysed. These samples were collected fromboreholes spread across the Northern (Ringbult) and Southern (Grootwater and Groenfontein) areasof the overall lease area, and included coal exposed in the pit walls of the Bulk Sample pit in thecentral area. The samples were composited as shown in Table 5-6.Table 5-6: Summary of Mafutha geochemical samplesSample ID Sasol Lithocodes Description<strong>SRK</strong>-01 CON Conglomerate<strong>SRK</strong>-02MST-SID- CSHSiderite, 10% bright coal, coal shale, mudstone,40% bright coal, Mudstone, Bright StrippedBanded coal, mudstone<strong>SRK</strong>-03 PIR-CSH Pyrite & Coal shale<strong>SRK</strong>-04 SST Sandstone<strong>SRK</strong>-05 SAN Sand<strong>SRK</strong>-06 MST-C Mudstone & Coal<strong>SRK</strong>-07 CSH Coal Shale<strong>SRK</strong>-08 MST Mudstone<strong>SRK</strong>-09 SST Sandstone<strong>SRK</strong>-10 MST-C-CS Mudstone, Coal, Coal Shale<strong>SRK</strong>-11 MST-C Mudstone & Coal<strong>SRK</strong>-12 SID-C-MST Siderite, Coal and Mudstone<strong>SRK</strong>13 MST Mudstone<strong>SRK</strong>-14 C Coal<strong>SRK</strong>-15 C (Pit Wall) Coal seamGOGP/LAKJ Report_April2013_19April2013 (1)_Final_Ludi_22052013 April 2013
<strong>SRK</strong> <strong>Consulting</strong>: 447493: <strong>Limpopo</strong> <strong>West</strong> Geochem Page 36Laboratory analysis undertaken on the core samples included the following:Elemental Composition by total digestion (Aqua Regia);Distilled Water Extract analysed for pH, EC, cations, anions and metals and metalloids by ICP;Acid Base Accounting (ABA) with sulfur speciation;Net Acid Generation;XRD for mineralogical determination;XRF for major elements; andTrace metals / metalloids by quantitative ICP scans.The water sample collected from the Bulk sample test pit located in the central are, taken torepresent shallow aquifer groundwater seepage across the pit, was analysed for the following :Physico-chemical parameters - pH, TDS;Major anions – HCO3, SO 4, Cl; F NO3; and Major cations – Ca, Mg; Na, K.The results of the study can be summarised as follows:The mineralogy results indicated that the samples are dominated by quartz, clay mineralskaolinite and smectite, mica muscovite with the ratio of the minerals being variable in thedifferent lithologies.Acid generating pyrite (FeS 2 ) was observed in the mudstone sample of the overburden and coalseam material with trace amounts detected in the sandstone sample.Acid neutralising minerals are present in all the lithologies analysed with the dominant carbonatemineral being calcite (CaCO 3 ) found in trace amounts in all samples, except sandstone in theinterburden where ankerite (Ca(Fe, Mg, Mn)(CO 3 ) 2 ) was dominant.The ABA results indicated that most of the samples contain low sulfide resulting in low AP, withthe exception of mudstone from the overburden and the coal seam samples. The NPR indicatedthat the mudstone, sandstone and coal lithologies are potentially acid generating, the rest of thelithologies are non acid generating.The NAG test is generally used to confirm ABA results. Table 5-7 presents a summary of theABA and NAG test results. NAG results indicate that the lithologies associated with coal (MST-C, SST, and C) have the potential to generate acidity.The 1:4 solid to liquid ratio distilled water leach test results indicated that the overburdenlithologies seem to mobilise higher concentrations of metals than the interburden lithologies, withaluminium and iron being the only metals that are consistently mobilised at elevatedconcentrations from most of the overburden and interburden lithologies.The Bulk Pit water quality was slightly alkaline. the quality was characterised by high alkalinity,low sulfate concentrations and low concentrations of metals indicating that the water quality ofthe pit lake has not been significantly affected by acid ARD. The ratio of the sum of calcium andmagnesium to sulfate is above 1, indicating that carbonate dissolution is controlling pH.Table 5-7: ABA and NAG test results for the Sasol Mafutha Geochemical AssessmentWaste TypeOverburdenInterburdenLithologyCONSANMST-CMSTMST-CMSTMST-SID- CSHPIR-CSHSSTCSHABAassessmentNAGassessmentCommentHi pH/ S’fide ND/ Hi NPRS’fide ND/ Lo NPRLo S’fide/ Hi NPRS’fide dominates/ Lo NPRLo S’fide but NP NDRelatively Hi S’fide / Hi NPRHi pH/ Lo Sulfide/ Hi NPRHi pH/ Lo S’fide/ Hi NPRHi pH/ S’fide ND/ Hi NPRLo pH/ S’fide present/Marginal NPRDecisionGOGP/LAKJ Report_April2013_19April2013 (1)_Final_Ludi_22052013 April 2013
<strong>SRK</strong> <strong>Consulting</strong>: 447493: <strong>Limpopo</strong> <strong>West</strong> Geochem Page 37Waste TypeLithologyABAassessmentNAGassessmentCommentDecisionSSTLo pH/ S’fide present/ NP NDMST-C-CSHi pH/ Lo S’fide/ Hi NPRSID-C-MSTHi pH/ S’fide ND/ Hi NPRCLo pH/ S’fide present/ Lo NPRCoal SeamC (Pit Wall)Lo pH/ Hi S’fide/ NPR OKSource: <strong>SRK</strong>, 2011-Green: Non-Acid Forming, Red-Potentially Acid Generating, Yellow-Uncertain, S’fide-Sulfide5.4.3 SummaryTestworkABANAG pHMetalLeachingA summary of the key findings of the geochemical studies is present in Table 5-8.Table 5-8: Summary of Key Findings of Geochemical Studies<strong>Limpopo</strong> <strong>West</strong> Leased area(WRC <strong>Study</strong>)zone 1 to 4 -PAF; zone 5 to 11 - PAF;Wegelegen shallow - NAF;Groenfontein deep - PAFWegelegen shallow - NAF;Groenfontein deep - PAF; Zone 1-11 -PAFMafutha Project areaMudstone (MST) - PAF; MudstoneCoal (MST-C) - PAF; Sandstone(SST) – PAF ;Coal (C) -PAFMudstone (MST) - PAF; MudstoneCoal (MST-C) - PAF; Sandstone(SST) - PAF; Coal (C) -PAFWaterberg Coalfield(IGS, 2009)Mudstone with coal -PAF; Shale with Coal(CSH) -PAF;Sandstone (belowcoal zone 2) - PAF;Discard - PAFMudstone with coal -PAF; Shale with Coal(CSH) -PAF;Sandstone (belowcoal zone 2) - PAF;Discard - PAFAl, Fe, Al, Fe Not undertakenSalinity SO 4, Ca, Mg SO 4, Cl, F, Ca, Mg Not undertakenExistingPit Lakelow Al and Fe; low SO 4, alkaline pH low Al and Fe; low SO 4, alkaline pH Not undertakenResultsAcidic except for Welgelegen shallow,Fe and Al rich, saline leachMST, MST-C, SST and C acidic, Feand Al rich, saline leachMST-C, CSH, SSTand Discard AcidicThe lithologies that have been identified to be potentially problematic in terms of acid generation inboth the Sasol Mafutha area and Waterberg Coalfield (IGS, 2009), and included lithologiesassociated with the coal seams. Aluminium and iron were found to be potential constituents ofconcern in both the Sasol Mafutha area and the <strong>Limpopo</strong> <strong>West</strong> lease area.GOGP/LAKJ Report_April2013_19April2013 (1)_Final_Ludi_22052013 April 2013
<strong>SRK</strong> <strong>Consulting</strong>: 447493: <strong>Limpopo</strong> <strong>West</strong> Geochem Page 386 Geochemical ImpactThe primary impact from typical ARD and ML processes associated with sulphide containinggeological materials either disturbed or generated by mining activities is contamination of water.This contamination of water is a result of oxidation processes releasing acidity and metals andsubsequent neutralisation and salinity release. The contamination of water also manifests innumerous ways which is sensitive to project life cycle, mining method, waste management, watermanagement and the ore and hard rock ARD and ML potential.The ARD and ML potential of the ore and waste rock associated with the proposed Phase 1 toPhase 3 mining activities were assessed using available water quality monitoring data, site geologydata and geochemical data obtained from analogue sites.Due to the similarity in ARD and ML risks associated with mining activities during the constructionand operation phase, the geochemical related impact assessment has been divided into two phases:Construction and Operation; andDecommissioning and Closure.Construction and Operational Phase ImpactsThe following mining and associated activities could result in deterioration in mine water qualitiesdue to the disturbance of geological materials with an ARD and ML potential:Stockpiling of ROMStockpiling of waste rock;Excavation of the Pit;Use of mine water during operations; andSurface Runoff and decant from the Pit.The contaminated mine water quality will lead to deterioration in the quality of mine water dischargedfrom the mine with possible exceedances of effluent standards and downstream surface water andgroundwater impacts.Decommissioning and Closure ImpactsARD and ML processes associated with waste rocks and excavated pits. This contamination ofwater is a result of oxidation processes releasing acidity and metals and subsequent neutralisationand salinity release.6.1 Recommended Mitigation MeasuresBased on the potential mine water quality impacts identified to generate acidity, the following sectiondescribes the associated mitigation measures that the PLWM project is required to implement,aimed at reducing potential negative environmental impacts.6.1.1 Construction and Operational Phase Mitigation MeasuresThe following operational water management strategy is proposed for the PLWM operations:Isolate future mining and backfill areas from the current mine water management reticulationsystem;Selective handling of PAG and Non-PAG spoils. The spoils would be stockpiled in a manner thatallows PAG material to be accessed first during backfilling so it can be placed at the bottom ofthe pit after the final cut. This will require site specific geochemical characterisation of theindividual lithological units,GOGP/LAKJ Report_April2013_19April2013 (1)_Final_Ludi_22052013 April 2013
<strong>SRK</strong> <strong>Consulting</strong>: 447493: <strong>Limpopo</strong> <strong>West</strong> Geochem Page 39Determine and agree effluent discharge standards with Authorities that need to be adhered to bythe mine during the operational and closure phases and resolve the question around currentdischarge qualities and exceedence;Develop and implement a mine water quality monitoring system for mine water generated fromnew mining areas and backfill areas;The mine water generated from these areas should have mine water management infrastructurein place that will allow for the following:If the quality of the mine water falls within the agreed mine water discharge quality parameters, itcan be released to the current mine water reticulation system and managed in the same way asthe current mine water is managed (assuming it is upgraded to handle the additional mine waterflows); andIf the quality exceeds the agreed mine water quality discharge parameters, the mine water willbe managed in a separate mine water reticulation system that either allows for use elsewhere inthe operation and/or storage (unlikely due to safety concerns) and/or treatment, discharge or reuse.An ARD management plan should be developed and implemented to manage the ARD risk from thepit and spoils stockpiles. It should consist of:Acid base accounting (ABA) testing of the individual key lithologies to determine ARD risk andavailability of excess neutralising potential for ARD risk reduction. The ABA monitoring should bedone annually for first two years where after the monitoring programme should be revised aspart of the ARD management plan.Incorporation of ABA results into the existing block model to indicate areas or material types ofhigh, low and medium ARD risk potential.Field kinetic test programme including the installation of field lysimeters on site to assess sitespecific metal leaching rates and drainage quality for inclusion in the monitoring database.6.1.2 Decommissioning and Closure Phase Mitigation MeasuresThe following measures are recommended:Conduct suitable hydrogeological and geochemical investigations to conceptualise the minewater system at closure. These investigations will include the development of baseline data,conceptualisation of the mine workings, modelling of key flow and geochemical processes andevaluation of alternative mine water management strategies using the models. It is proposedthat these investigations be conducted during the operational phase of the mine and completedin time for the last 5 year of planning before closure;In the absence of a detailed understanding of the post closure mine water system, a pump andtreat water management post closure mitigation strategy is recommended. This strategy isrobust against the uncertainty, however, will provide the required environmental protection. Thisstrategy can be changed and optimised should the hydrogeological and geochemicalinvestigations demonstrate alternative and less onerous mitigation strategies.Undertake geochemical modelling to evaluate the potential pit lake chemistry at post closure andwill mainly involve geochemical modelling of key flow and geochemical processes associatedwith the pit, this will include the following tasks to be undertaken:oooooNumerical predictions using hydrogeological flow models to predict potentialgroundwater flow that will influence the pit water quality,Hydrological modelling to demonstrate the filling capacity of the pit once pumpingceases at closure and post-closure phase of the mine,On site water chemistry of the pit water in conjunction with predicted releasechemistries from geochemical characterisation testing will be required as inputparameters in the geochemical model to predict potential water quality,Development of representative conceptual models as a basis for numerical modeldevelopment and to illustrate geochemical, hydrogeological and hydrologicalprocesses;Geochemical modelling to ensure balanced water chemistry will be achieved byusing the United States Geological Survey (USGS) programme PHREEQC andGOGP/LAKJ Report_April2013_19April2013 (1)_Final_Ludi_22052013 April 2013
<strong>SRK</strong> <strong>Consulting</strong>: 447493: <strong>Limpopo</strong> <strong>West</strong> Geochem Page 40odevelopment of a geochemical model to enable calibration with existing pit waterchemistry, andPrediction of potential pit water quality at post closure.7 CONCLUSIONIn conclusion, the geochemical assessment indicates that ARD and ML risks are associated with theproposed mining activities at the PLWM open pit mine. These ARD and ML risks could lead to minewater qualities that exceed South African wastewater quality guidelines and will require mitigation.Given the site specific uncertainties related to the significance and extent of these ARD and MLimpacts, a number of precautionary ARD and ML mitigation measures and strategies are proposedthat, if implemented, will manage these ARD and ML risks to acceptable risk levels that will providethe required levels of protection of the receiving surface and groundwater resource.Prepared byPassy GogaGeochemistReviewed byJames LakeGOGP/LAKJ Report_April2013_19April2013 (1)_Final_Ludi_22052013 April 2013
<strong>SRK</strong> <strong>Consulting</strong>: 447493: <strong>Limpopo</strong> <strong>West</strong> Geochem Page 41All data used as source material plus the text, tables, figures, and attachments of this documenthave been reviewed and prepared in accordance with generally accepted professional engineeringand environmental practices.GOGP/LAKJ Report_April2013_19April2013 (1)_Final_Ludi_22052013 April 2013
<strong>SRK</strong> <strong>Consulting</strong>: 447493: <strong>Limpopo</strong> <strong>West</strong> Geochem Page 428 ReferencesINAP, 2009. Global Acid Rock Drainage Guide. International Network on Acid Production (INAP).Price, W.A. 2009. Prediction Manual for Drainage Chemistry from Sulphidic Geological Material.MEND Report 1.20.1Bester M, 2009. Groundwater Resource Assessment of the Waterberg Coal Reserves. UnpublishedMSc Thesis. Institute of Groundwater Studies, University of the Free State.Bester M, Vermeulen PD (2010). Investigation of potential water quality and quantity impactsassociated with mining of the shallow Waterberg coal reserves, west of the Daarby Fault, <strong>Limpopo</strong>Province, South Africa. ISSN 1816-7950, Water SA Vol. 36 No. 5. October, 2010.Snyman, C.P (1998) “Coal”. In: Wilson, MGC and Anhaeusser (Ed). The <strong>Mine</strong>ral Resources of SouthAfrica. Handbook 16, Council for Geosciences, 6 th Edition. ISBN 1-875061-52-5.<strong>SRK</strong> Pty (Ltd), 2011. Mafutha Environmental Authorisation Programme (MEAP) – Specialist Report:Geochemical Characterisation of the Sasol Mafutha Project. Unpublished Report prepared for SasolMining & Exxaro. Report Number: 425112/Geochemistry.<strong>SRK</strong> Pty (Ltd), 2011. Mafutha Environmental Authorisation Programme (MEAP) – Specialist Report:Baseline Hydrogeological <strong>Study</strong>. Unpublished Report prepared for Sasol Mining & Exxaro. ReportNumber: 409399/1.GOGP/LAKJ Report_April2013_19April2013 (1)_Final_Ludi_22052013 April 2013
<strong>SRK</strong> <strong>Consulting</strong>: 447493: <strong>Limpopo</strong> <strong>West</strong> Geochem Page 43AppendicesGOGP/LAKJ Report_April2013_19April2013 (1)_Final_Ludi_22052013 April 2013
<strong>SRK</strong> <strong>Consulting</strong>: 447493: <strong>Limpopo</strong> <strong>West</strong> Geochem Page 44Appendix A: Summary of Laboratory ResultsGOGP/LAKJ Report_April2013_19April2013 (1)_Final_Ludi_22052013 April 2013
<strong>SRK</strong> <strong>Consulting</strong>: 447493: <strong>Limpopo</strong> <strong>West</strong> Geochem Page 45<strong>SRK</strong> Report Distribution RecordReport No. 447493Copy No. 3Name/Title Company Copy Date Authorised byBertie Botha Sasol Mining 1 April 2013 James LakeNadia Mol <strong>SRK</strong> <strong>Consulting</strong> 2 April 2013 James LakeLibrary <strong>SRK</strong> <strong>Consulting</strong> 3 April 2013 James LakeApproval Signature:This report is protected by copyright vested in <strong>SRK</strong> (SA) (Pty) Ltd. It may not be reproduced ortransmitted in any form or by any means whatsoever to any person without the written permission ofthe copyright holder, <strong>SRK</strong>.GOGP/LAKJ Report_April2013_19April2013 (1)_Final_Ludi_22052013 April 2013