NTEGRA Spectra - NT-MDT
NTEGRA Spectra - NT-MDT
NTEGRA Spectra - NT-MDT

Create successful ePaper yourself
Turn your PDF publications into a flip-book with our unique Google optimized e-Paper software.
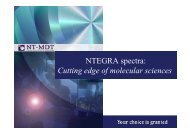
Intensity distribution of different Raman bands &AFM topography image of individual <strong>NT</strong> bundleRBM-band D-band G - - band G + - bandAFM height AFM phaseIntegration time: 100 ms / point. 50*150 points.Total spectrum was acquired at each point of the scan. After measurement, different Ramanbands are chosen and their intensity distribution is analyzed. All the images (AFM + all Ramanmaps) can obtained simultaneously, in a single experiment, without any moving of the sampleor objective<strong><strong>NT</strong>EGRA</strong> <strong>Spectra</strong>