NTEGRA Spectra - NT-MDT
NTEGRA Spectra - NT-MDT
NTEGRA Spectra - NT-MDT

You also want an ePaper? Increase the reach of your titles
YUMPU automatically turns print PDFs into web optimized ePapers that Google loves.
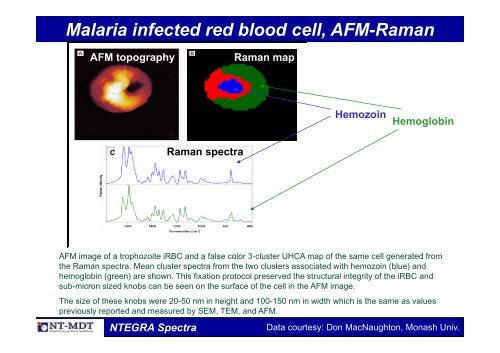
Malaria infected red blood cell, AFM-RamanAFM topographyRaman mapHemozoin HemoglobinCRaman spectraAFM image of a trophozoite iRBC and a false color 3-cluster UHCA map of the same cell generated fromthe Raman spectra. Mean cluster spectra from the two clusters associated with hemozoin (blue) andhemoglobin (green) are shown. This fixation protocol preserved the structural integrity of the iRBC andsub-micron sized knobs can be seen on the surface of the cell in the AFM image.The size of these knobs were 20-50 nm in height and 100-150 nm in width which is the same as valuespreviously reported and measured by SEM, TEM, and AFM.<strong><strong>NT</strong>EGRA</strong> <strong>Spectra</strong>Data courtesy: Don MacNaughton, Monash Univ.