Chapter 6 Why Authoritarian Parties? The Regime Party as an ...
Chapter 6 Why Authoritarian Parties? The Regime Party as an ...
Chapter 6 Why Authoritarian Parties? The Regime Party as an ...

Create successful ePaper yourself
Turn your PDF publications into a flip-book with our unique Google optimized e-Paper software.
CHAPTER 6<br />
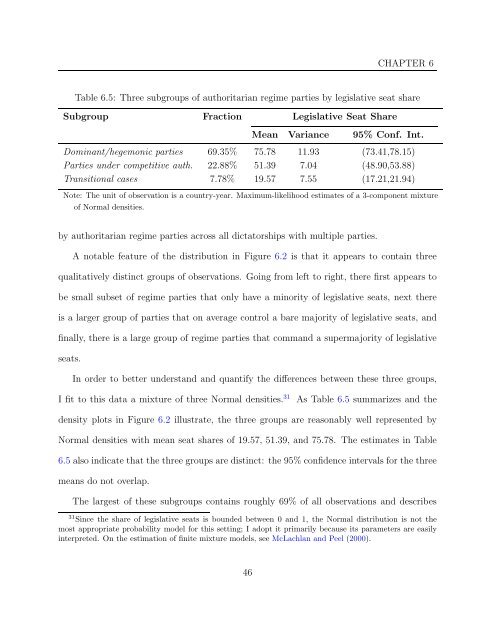
Table 6.5: Three subgroups of authoritari<strong>an</strong> regime parties by legislative seat share<br />
Subgroup Fraction Legislative Seat Share<br />
Me<strong>an</strong> Vari<strong>an</strong>ce 95% Conf. Int.<br />
Domin<strong>an</strong>t/hegemonic parties 69.35% 75.78 11.93 (73.41,78.15)<br />
<strong>Parties</strong> under competitive auth. 22.88% 51.39 7.04 (48.90,53.88)<br />
Tr<strong>an</strong>sitional c<strong>as</strong>es 7.78% 19.57 7.55 (17.21,21.94)<br />
Note: <strong>The</strong> unit of observation is a country-year. Maximum-likelihood estimates of a 3-component mixture<br />
of Normal densities.<br />
by authoritari<strong>an</strong> regime parties across all dictatorships with multiple parties.<br />
A notable feature of the distribution in Figure 6.2 is that it appears to contain three<br />
qualitatively distinct groups of observations. Going from left to right, there first appears to<br />
be small subset of regime parties that only have a minority of legislative seats, next there<br />
is a larger group of parties that on average control a bare majority of legislative seats, <strong>an</strong>d<br />
finally, there is a large group of regime parties that comm<strong>an</strong>d a supermajority of legislative<br />
seats.<br />
In order to better underst<strong>an</strong>d <strong>an</strong>d qu<strong>an</strong>tify the differences between these three groups,<br />
I fit to this data a mixture of three Normal densities. 31 As Table 6.5 summarizes <strong>an</strong>d the<br />
density plots in Figure 6.2 illustrate, the three groups are re<strong>as</strong>onably well represented by<br />
Normal densities with me<strong>an</strong> seat shares of 19.57, 51.39, <strong>an</strong>d 75.78. <strong>The</strong> estimates in Table<br />
6.5 also indicate that the three groups are distinct: the 95% confidence intervals for the three<br />
me<strong>an</strong>s do not overlap.<br />
<strong>The</strong> largest of these subgroups contains roughly 69% of all observations <strong>an</strong>d describes<br />
31 Since the share of legislative seats is bounded between 0 <strong>an</strong>d 1, the Normal distribution is not the<br />
most appropriate probability model for this setting; I adopt it primarily because its parameters are e<strong>as</strong>ily<br />
interpreted. On the estimation of finite mixture models, see McLachl<strong>an</strong> <strong>an</strong>d Peel (2000).<br />
46