UNIVERSITY OF READING - E-Library - WMO
UNIVERSITY OF READING - E-Library - WMO
UNIVERSITY OF READING - E-Library - WMO

You also want an ePaper? Increase the reach of your titles
YUMPU automatically turns print PDFs into web optimized ePapers that Google loves.
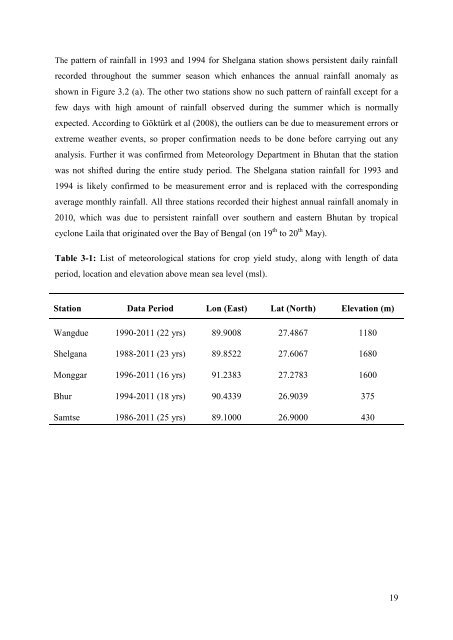
The pattern of rainfall in 1993 and 1994 for Shelgana station shows persistent daily rainfallrecorded throughout the summer season which enhances the annual rainfall anomaly asshown in Figure 3.2 (a). The other two stations show no such pattern of rainfall except for afew days with high amount of rainfall observed during the summer which is normallyexpected. According to Göktürk et al (2008), the outliers can be due to measurement errors orextreme weather events, so proper confirmation needs to be done before carrying out anyanalysis. Further it was confirmed from Meteorology Department in Bhutan that the stationwas not shifted during the entire study period. The Shelgana station rainfall for 1993 and1994 is likely confirmed to be measurement error and is replaced with the correspondingaverage monthly rainfall. All three stations recorded their highest annual rainfall anomaly in2010, which was due to persistent rainfall over southern and eastern Bhutan by tropicalcyclone Laila that originated over the Bay of Bengal (on 19 th to 20 th May).Table 3-1: List of meteorological stations for crop yield study, along with length of dataperiod, location and elevation above mean sea level (msl).Station Data Period Lon (East) Lat (North) Elevation (m)Wangdue 1990-2011 (22 yrs) 89.9008 27.4867 1180Shelgana 1988-2011 (23 yrs) 89.8522 27.6067 1680Monggar 1996-2011 (16 yrs) 91.2383 27.2783 1600Bhur 1994-2011 (18 yrs) 90.4339 26.9039 375Samtse 1986-2011 (25 yrs) 89.1000 26.9000 43019