UNIVERSITY OF READING - E-Library - WMO
UNIVERSITY OF READING - E-Library - WMO
UNIVERSITY OF READING - E-Library - WMO

You also want an ePaper? Increase the reach of your titles
YUMPU automatically turns print PDFs into web optimized ePapers that Google loves.
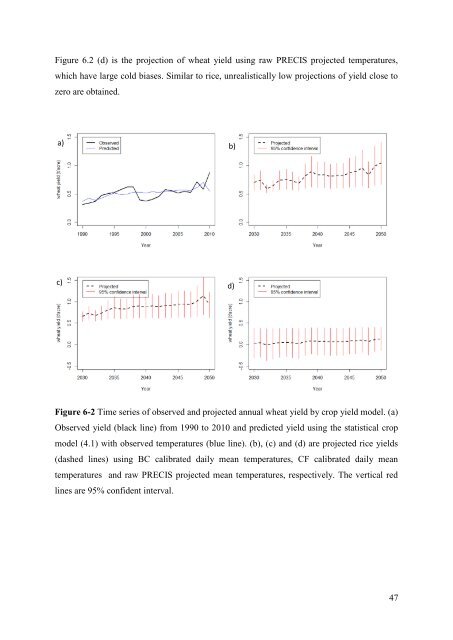
Figure 6.2 (d) is the projection of wheat yield using raw PRECIS projected temperatures,which have large cold biases. Similar to rice, unrealistically low projections of yield close tozero are obtained.a) b)c)d)Figure 6-2 Time series of observed and projected annual wheat yield by crop yield model. (a)Observed yield (black line) from 1990 to 2010 and predicted yield using the statistical cropmodel (4.1) with observed temperatures (blue line). (b), (c) and (d) are projected rice yields(dashed lines) using BC calibrated daily mean temperatures, CF calibrated daily meantemperatures and raw PRECIS projected mean temperatures, respectively. The vertical redlines are 95% confident interval.47