UNIVERSITY OF READING - E-Library - WMO
UNIVERSITY OF READING - E-Library - WMO
UNIVERSITY OF READING - E-Library - WMO

Create successful ePaper yourself
Turn your PDF publications into a flip-book with our unique Google optimized e-Paper software.
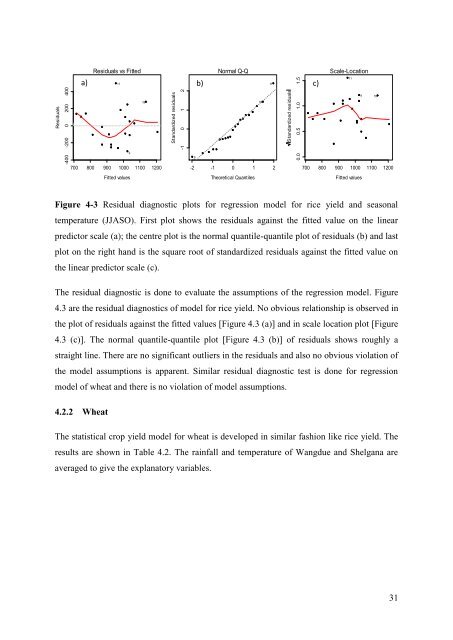
Residuals-400 -200 0 200 400Standardized residuals-1 0 1 2Standardized residuals0.0 0.5 1.0 1.5Standardized residuals-1 0 1 2Residuals vs FittedNormal Q-Qa) 11b)11c)Scale-Location11Residu119 19191999Cook's dist700 800 900 1000 1100 1200-2 -1 0 1 2700 800 900 1000 1100 12000.00 0.05 0Fitted valuesTheoretical QuantilesFitted valuesFigure 4-3 Residual diagnostic plots for regression model for rice yield and seasonaltemperature (JJASO). First plot shows the residuals against the fitted value on the linearpredictor scale (a); the centre plot is the normal quantile-quantile plot of residuals (b) and lastplot on the right hand is the square root of standardized residuals against the fitted value onthe linear predictor scale (c).The residual diagnostic is done to evaluate the assumptions of the regression model. Figure4.3 are the residual diagnostics of model for rice yield. No obvious relationship is observed inthe plot of residuals against the fitted values [Figure 4.3 (a)] and in scale location plot [Figure4.3 (c)]. The normal quantile-quantile plot [Figure 4.3 (b)] of residuals shows roughly astraight line. There are no significant outliers in the residuals and also no obvious violation ofthe model assumptions is apparent. Similar residual diagnostic test is done for regressionmodel of wheat and there is no violation of model assumptions.4.2.2 WheatThe statistical crop yield model for wheat is developed in similar fashion like rice yield. Theresults are shown in Table 4.2. The rainfall and temperature of Wangdue and Shelgana areaveraged to give the explanatory variables.31