Guidelines for Best Practice and Quality Checking of Ortho Imagery
Guidelines for Best Practice and Quality Checking of Ortho Imagery
Guidelines for Best Practice and Quality Checking of Ortho Imagery

You also want an ePaper? Increase the reach of your titles
YUMPU automatically turns print PDFs into web optimized ePapers that Google loves.
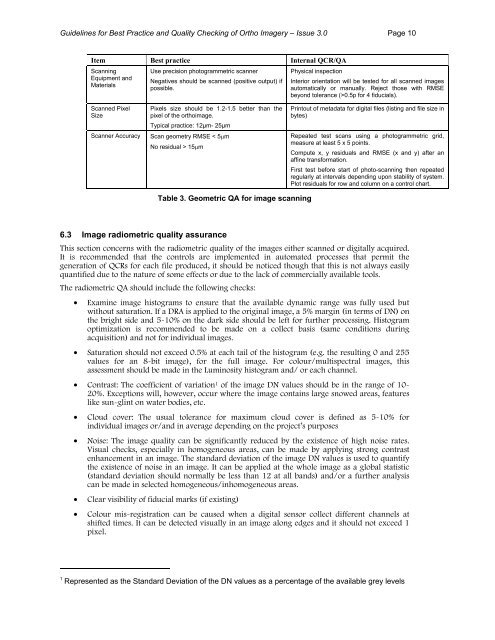
<strong>Guidelines</strong> <strong>for</strong> <strong>Best</strong> <strong>Practice</strong> <strong>and</strong> <strong>Quality</strong> <strong>Checking</strong> <strong>of</strong> <strong>Ortho</strong> <strong>Imagery</strong> – Issue 3.0 Page 10Item <strong>Best</strong> practice Internal QCR/QAScanningEquipment <strong>and</strong>MaterialsUse precision photogrammetric scannerNegatives should be scanned (positive output) ifpossible.Physical inspectionInterior orientation will be tested <strong>for</strong> all scanned imagesautomatically or manually. Reject those with RMSEbeyond tolerance (>0.5p <strong>for</strong> 4 fiducials).Scanned PixelSizePixels size should be 1.2-1.5 better than thepixel <strong>of</strong> the orthoimage.Typical practice: 12µm- 25µmScanner Accuracy Scan geometry RMSE < 5µmNo residual > 15µmPrintout <strong>of</strong> metadata <strong>for</strong> digital files (listing <strong>and</strong> file size inbytes)Repeated test scans using a photogrammetric grid,measure at least 5 x 5 points.Compute x, y residuals <strong>and</strong> RMSE (x <strong>and</strong> y) after anaffine trans<strong>for</strong>mation.First test be<strong>for</strong>e start <strong>of</strong> photo-scanning then repeatedregularly at intervals depending upon stability <strong>of</strong> system.Plot residuals <strong>for</strong> row <strong>and</strong> column on a control chart.Table 3. Geometric QA <strong>for</strong> image scanning6.3 Image radiometric quality assuranceThis section concerns with the radiometric quality <strong>of</strong> the images either scanned or digitally acquired.It is recommended that the controls are implemented in automated processes that permit thegeneration <strong>of</strong> QCRs <strong>for</strong> each file produced, it should be noticed though that this is not always easilyquantified due to the nature <strong>of</strong> some effects or due to the lack <strong>of</strong> commercially available tools.The radiometric QA should include the following checks:• Examine image histograms to ensure that the available dynamic range was fully used butwithout saturation. If a DRA is applied to the original image, a 5% margin (in terms <strong>of</strong> DN) onthe bright side <strong>and</strong> 5-10% on the dark side should be left <strong>for</strong> further processing. Histogramoptimization is recommended to be made on a collect basis (same conditions duringacquisition) <strong>and</strong> not <strong>for</strong> individual images.• Saturation should not exceed 0.5% at each tail <strong>of</strong> the histogram (e.g. the resulting 0 <strong>and</strong> 255values <strong>for</strong> an 8-bit image), <strong>for</strong> the full image. For colour/multispectral images, thisassessment should be made in the Luminosity histogram <strong>and</strong>/ or each channel.• Contrast: The coefficient <strong>of</strong> variation 1 <strong>of</strong> the image DN values should be in the range <strong>of</strong> 10-20%. Exceptions will, however, occur where the image contains large snowed areas, featureslike sun-glint on water bodies, etc.• Cloud cover: The usual tolerance <strong>for</strong> maximum cloud cover is defined as 5-10% <strong>for</strong>individual images or/<strong>and</strong> in average depending on the project’s purposes• Noise: The image quality can be significantly reduced by the existence <strong>of</strong> high noise rates.Visual checks, especially in homogeneous areas, can be made by applying strong contrastenhancement in an image. The st<strong>and</strong>ard deviation <strong>of</strong> the image DN values is used to quantifythe existence <strong>of</strong> noise in an image. It can be applied at the whole image as a global statistic(st<strong>and</strong>ard deviation should normally be less than 12 at all b<strong>and</strong>s) <strong>and</strong>/or a further analysiscan be made in selected homogeneous/inhomogeneous areas.• Clear visibility <strong>of</strong> fiducial marks (if existing)• Colour mis-registration can be caused when a digital sensor collect different channels atshifted times. It can be detected visually in an image along edges <strong>and</strong> it should not exceed 1pixel.1 Represented as the St<strong>and</strong>ard Deviation <strong>of</strong> the DN values as a percentage <strong>of</strong> the available grey levels