Download Annual Report 2006 - Foskor
Download Annual Report 2006 - Foskor
Download Annual Report 2006 - Foskor

Create successful ePaper yourself
Turn your PDF publications into a flip-book with our unique Google optimized e-Paper software.
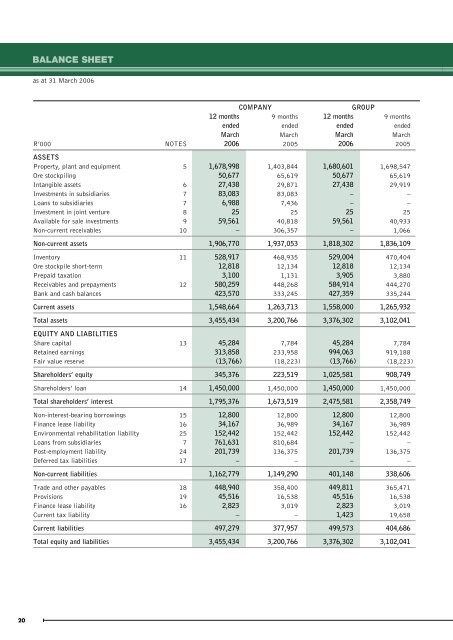
BALANCE SHEETas at 31 March <strong>2006</strong>COMPANYGROUP12 months 9 months 12 months 9 monthsended ended ended endedMarch March March MarchR’000 NOTES <strong>2006</strong> 2005 <strong>2006</strong> 2005ASSETSProperty, plant and equipment 5 1,678,998 1,403,844 1,680,601 1,698,547Ore stockpiling 50,677 65,619 50,677 65,619Intangible assets 6 27,438 29,871 27,438 29,919Investments in subsidiaries 7 83,083 83,083 – –Loans to subsidiaries 7 6,988 7,436 – –Investment in joint venture 8 25 25 25 25Available for sale investments 9 59,561 40,818 59,561 40,933Non-current receivables 10 – 306,357 – 1,066Non-current assets 1,906,770 1,937,053 1,818,302 1,836,109Inventory 11 528,917 468,935 529,004 470,404Ore stockpile short-term 12,818 12,134 12,818 12,134Prepaid taxation 3,100 1,131 3,905 3,880Receivables and prepayments 12 580,259 448,268 584,914 444,270Bank and cash balances 423,570 333,245 427,359 335,244Current assets 1,548,664 1,263,713 1,558,000 1,265,932Total assets 3,455,434 3,200,766 3,376,302 3,102,041EQUITY AND LIABILITIESShare capital 13 45,284 7,784 45,284 7,784Retained earnings 313,858 233,958 994,063 919,188Fair value reserve (13,766) (18,223) (13,766) (18,223)Shareholders’ equity 345,376 223,519 1,025,581 908,749Shareholders’ loan 14 1,450,000 1,450,000 1,450,000 1,450,000Total shareholders’ interest 1,795,376 1,673,519 2,475,581 2,358,749Non-interest-bearing borrowings 15 12,800 12,800 12,800 12,800Finance lease liability 16 34,167 36,989 34,167 36,989Environmental rehabilitation liability 25 152,442 152,442 152,442 152,442Loans from subsidiaries 7 761,631 810,684 – –Post-employment liability 24 201,739 136,375 201,739 136,375Deferred tax liabilities 17 – – – –Non-current liabilities 1,162,779 1,149,290 401,148 338,606Trade and other payables 18 448,940 358,400 449,811 365,471Provisions 19 45,516 16,538 45,516 16,538Finance lease liability 16 2,823 3,019 2,823 3,019Current tax liability – – 1,423 19,658Current liabilities 497,279 377,957 499,573 404,686Total equity and liabilities 3,455,434 3,200,766 3,376,302 3,102,04120