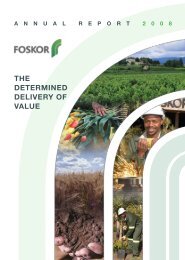
Download Annual Report 2006 - Foskor
Download Annual Report 2006 - Foskor
Download Annual Report 2006 - Foskor
You also want an ePaper? Increase the reach of your titles
YUMPU automatically turns print PDFs into web optimized ePapers that Google loves.
FIVE YEAR REVIEW<strong>Foskor</strong> Group<strong>Annual</strong>ised 9 Months<strong>2006</strong> 2005 2005 2004 2003 2002BALANCE SHEETProperty, plant and equipment 1,681 1,699 1,967 1,831 1,724Non-current assets 138 138 111 132 112Current assets 1,558 1,266 948 1,159 1,378Total assets 3,376 3,102 3,026 3,121 3,214Non current liabilities 401 338 677 1,082 1,004Current liabilities 500 405 468 481 643Total liabilities 901 743 1,145 1,563 1,647Net assets 2,476 2,359 1,882 1,559 1,567Shareholders’ equity 1,026 909 1,338 1,559 1,567Shareholders’ loan- Non-interest bearing 1,450 1,450 544 – –Total shareholders’ interest 2,476 2,359 1,882 1,559 1,567Interest-bearing debt (net of cash) – – 483 582 389RatiosDebt/equity ratio (%)(debt net of cash) 0% 0% 26% 46% 42%Current assets to current liabilities(ratio) 3.1 3.1 2.0 2.4 2.1CASH FLOW STATEMENTOperating profit/(loss)before workingcapital changes 197 12 (109) 278 605Working capital changes (86) 24 119 119 (154)Cash generated from operations 111 36 11 397 451Net cash inflow/(outflow) fromoperating activities 132 (9) (62) 52 240Net cash (outflow) frominvesting activities (37) (118) (283) (244) (563)Free cash inflow/(outflow) 95 (127) (345) (193) (322)55


