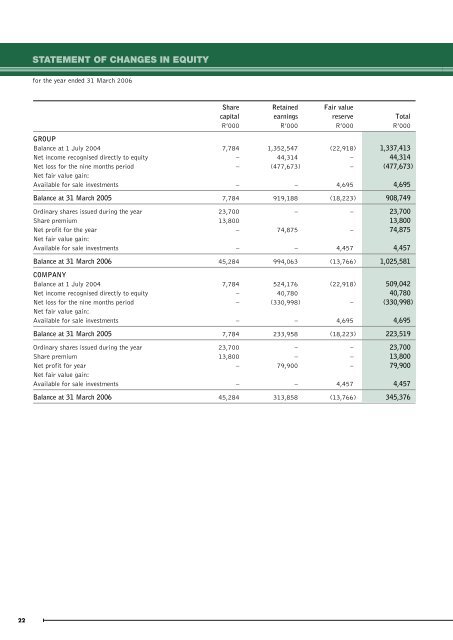
STATEMENT OF CHANGES IN EQUITYfor the year ended 31 March <strong>2006</strong>Share Retained Fair valuecapital earnings reserve TotalR’000 R’000 R’000 R’000GROUPBalance at 1 July 2004 7,784 1,352,547 (22,918) 1,337,413Net income recognised directly to equity – 44,314 – 44,314Net loss for the nine months period – (477,673) – (477,673)Net fair value gain:Available for sale investments – – 4,695 4,695Balance at 31 March 2005 7,784 919,188 (18,223) 908,749Ordinary shares issued during the year 23,700 – – 23,700Share premium 13,800 13,800Net profit for the year – 74,875 – 74,875Net fair value gain:Available for sale investments – – 4,457 4,457Balance at 31 March <strong>2006</strong> 45,284 994,063 (13,766) 1,025,581COMPANYBalance at 1 July 2004 7,784 524,176 (22,918) 509,042Net income recognised directly to equity – 40,780 40,780Net loss for the nine months period – (330,998) – (330,998)Net fair value gain:Available for sale investments – – 4,695 4,695Balance at 31 March 2005 7,784 233,958 (18,223) 223,519Ordinary shares issued during the year 23,700 – – 23,700Share premium 13,800 – – 13,800Net profit for year – 79,900 – 79,900Net fair value gain:Available for sale investments – – 4,457 4,457Balance at 31 March <strong>2006</strong> 45,284 313,858 (13,766) 345,37622
CASH FLOW STATEMENTfor the year ended 31 March <strong>2006</strong>COMPANYGROUP12 months 9 months 12 months 9 monthsended ended ended endedMarch March March MarchR’000 NOTE <strong>2006</strong> 2005 <strong>2006</strong> 2005CASH FLOWS FROM OPERATINGACTIVITIESCash generated from/(applied to) operations 26 124,679 (85,825) 111,483 35,709Net finance income/(costs) 27,560 19,318 27,777 (2,082)Net foreign exchange gains/(losses) 11,619 (5,386) 11,633 (5,484)Dividend received 4,591 173,235 – –Taxation (1,961) 4,075 (18,886) (37,600)Net cash generated from/(used in)operating activities 166,488 105,417 132,007 (9,457)CASH FLOW FROM INVESTINGACTIVITIESAdditions to property, plant and equipment (105,240) (126,529) (105,247) (133,420)Acquisition of computer software – (490) – (490)Proceeds on disposal of property, plant and equipment 37,807 11,533 37,807 11,533Movements in loans to subsidiaries (48,605) (117,562) – –Investment by Coromandel Fertilisers Limited 37,500 – 37,500 –Disposal of unlisted investments – – – 403Contribution made to environmental rehabilitation trust (8,000) – (8,000) –Repayment of non-current receivables 13,393 1,012 1,066 3,420Investment in joint venture – 412 – 412Net cash used in investing activities (73,145) (231,624) (36,874) (118,142)CASH FLOW FROM FINANCINGACTIVITIES(Decrease)/increase in finance lease liability (2,822) 40,008 (2,822) 40,008Decrease in current portion of financelease liability (196) – (196) –Decrease in interest-bearing borrowings – (397,062) – (397,062)Decrease in current portion of interestbearingborrowings – (95,767) – (95,767)Increase in shareholders’ loans – 905,745 – 905,745Net cash (used in)/generated fromfinancing activities (3,018) 452,924 (3,018) 452,924NET INCREASE IN CASHAND CASH EQUIVALENTS 90,325 326,717 92,115 325,325CASH AND CASH EQUIVALENTS ATBEGINNING OF YEAR 333,245 6,528 335,244 9,919CASH AT BANK AND IN HAND ATEND OF YEAR 423,570 333,245 427,359 335,244CASH AT BANK AND IN HAND 423,570 333,245 427,359 335,244BANK OVERDRAFT – – – –23