- Page 2:
Praise for Fundamentals of WiMAXThi
- Page 6:
Fundamentals of WiMAX is a comprehe
- Page 10:
Fundamentals of WiMAX
- Page 14:
Fundamentals of WiMAXUnderstanding
- Page 18:
Dedicated to Catherine and my paren
- Page 22:
ContentsForewordPrefaceAcknowledgme
- Page 26:
Contentsxiii3.3.2 Analysis of Cellu
- Page 30:
Contentsxv6.1.1 Random Access versu
- Page 34:
Contentsxvii9.1.1 Packet Header Sup
- Page 38:
ForewordWithin the last two decades
- Page 42:
PrefaceFundamentals of WiMAX was co
- Page 46:
AcknowledgmentsWe would like to tha
- Page 50:
AcknowledgmentsxxvRias Muhamed: I s
- Page 54:
About the AuthorsJeffrey G. Andrews
- Page 58:
PARTIOverview ofWiMAX
- Page 62:
C H A P T E R 1Introduction to Broa
- Page 66:
1.1 Evolution of Broadband Wireless
- Page 70:
1.1 Evolution of Broadband Wireless
- Page 74:
1.1 Evolution of Broadband Wireless
- Page 78:
1.2 Fixed Broadband Wireless: Marke
- Page 82:
1.4 WiMAX and Other Broadband Wirel
- Page 86:
1.4 WiMAX and Other Broadband Wirel
- Page 90:
1.5 Spectrum Options for Broadband
- Page 94:
1.5 Spectrum Options for Broadband
- Page 98:
1.6 Business Challenges for Broadba
- Page 102:
1.7 Technical Challenges for Broadb
- Page 106:
1.7 Technical Challenges for Broadb
- Page 110:
1.7 Technical Challenges for Broadb
- Page 114:
1.7 Technical Challenges for Broadb
- Page 118:
1.7 Technical Challenges for Broadb
- Page 122:
C H A P T E R 2Overview of WiMAXAft
- Page 126:
2.1 Background on IEEE 802.16 and W
- Page 130:
2.2 Salient Features of WiMAX 37For
- Page 134:
2.3 WiMAX Physical Layer 39very fle
- Page 138:
2.3 WiMAX Physical Layer 41adaptive
- Page 142:
2.3 WiMAX Physical Layer 43Mobile W
- Page 146:
2.3 WiMAX Physical Layer 45OFDM Sym
- Page 150:
2.4 MAC-Layer Overview 47Table 2.4
- Page 154:
2.4 MAC-Layer Overview 49GMHOtherSH
- Page 158:
2.4 MAC-Layer Overview 51Table 2.6
- Page 162:
2.4 MAC-Layer Overview 53Three hand
- Page 166:
2.5 Advanced Features for Performan
- Page 170:
2.6 Reference Network Architecture
- Page 174:
2.7 Performance Characterization 59
- Page 178:
2.8 Summary and Conclusions 61Table
- Page 182:
2.9 Bibliography 63• WiMAX suppor
- Page 186:
PARTIITechnicalFoundations ofWiMAX
- Page 190:
C H A P T E R 3The Challenge ofBroa
- Page 194:
3.2 The Broadband Wireless Channel:
- Page 198: 3.2 The Broadband Wireless Channel:
- Page 202: 3.2 The Broadband Wireless Channel:
- Page 206: 3.2 The Broadband Wireless Channel:
- Page 210: 3.3 Cellular Systems 77To summarize
- Page 214: 3.3 Cellular Systems 79BBGCGCAAFDFD
- Page 218: 3.3 Cellular Systems 81BS 15BS 12BS
- Page 222: 3.3 Cellular Systems 8312316 25 341
- Page 226: 3.4 The Broadband Wireless Channel:
- Page 230: 3.4 The Broadband Wireless Channel:
- Page 234: 3.4 The Broadband Wireless Channel:
- Page 238: 3.5 Modeling Broadband Fading Chann
- Page 242: 3.5 Modeling Broadband Fading Chann
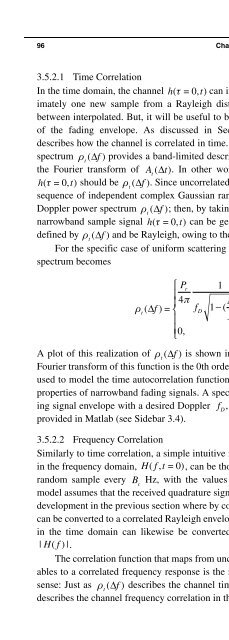
- Page 246: 3.5 Modeling Broadband Fading Chann
- Page 252: 98 Chapter 3 • The Challenge of B
- Page 256: 100 Chapter 3 • The Challenge of
- Page 260: 102 Chapter 3 • The Challenge of
- Page 264: 104 Chapter 3 • The Challenge of
- Page 268: 106 Chapter 3 • The Challenge of
- Page 272: 108 Chapter 3 • The Challenge of
- Page 276: 110 Chapter 3 • The Challenge of
- Page 280: 112 Chapter 3 • The Challenge of
- Page 284: 114 Chapter 4 • Orthogonal Freque
- Page 288: 116 Chapter 4 • Orthogonal Freque
- Page 292: 118 Chapter 4 • Orthogonal Freque
- Page 296: 120 Chapter 4 • Orthogonal Freque
- Page 300:
122 Chapter 4 • Orthogonal Freque
- Page 304:
124 Chapter 4 • Orthogonal Freque
- Page 308:
126 Chapter 4 • Orthogonal Freque
- Page 312:
128 Chapter 4 • Orthogonal Freque
- Page 316:
130 Chapter 4 • Orthogonal Freque
- Page 320:
132 Chapter 4 • Orthogonal Freque
- Page 324:
134 Chapter 4 • Orthogonal Freque
- Page 328:
136 Chapter 4 • Orthogonal Freque
- Page 332:
138 Chapter 4 • Orthogonal Freque
- Page 336:
140 Chapter 4 • Orthogonal Freque
- Page 340:
142 Chapter 4 • Orthogonal Freque
- Page 344:
144 Chapter 4 • Orthogonal Freque
- Page 348:
146 Chapter 4 • Orthogonal Freque
- Page 352:
This page intentionally left blank
- Page 356:
150 Chapter 5 • Multiple-Antenna
- Page 360:
152 Chapter 5 • Multiple-Antenna
- Page 364:
154 Chapter 5 • Multiple-Antenna
- Page 368:
156 Chapter 5 • Multiple-Antenna
- Page 372:
158 Chapter 5 • Multiple-Antenna
- Page 376:
160 Chapter 5 • Multiple-Antenna
- Page 380:
162 Chapter 5 • Multiple-Antenna
- Page 384:
164 Chapter 5 • Multiple-Antenna
- Page 388:
166 Chapter 5 • Multiple-Antenna
- Page 392:
168 Chapter 5 • Multiple-Antenna
- Page 396:
170 Chapter 5 • Multiple-Antenna
- Page 400:
172 Chapter 5 • Multiple-Antenna
- Page 404:
174 Chapter 5 • Multiple-Antenna
- Page 408:
176 Chapter 5 • Multiple-Antenna
- Page 412:
178 Chapter 5 • Multiple-Antenna
- Page 416:
180 Chapter 5 • Multiple-Antenna
- Page 420:
182 Chapter 5 • Multiple-Antenna
- Page 424:
184 Chapter 5 • Multiple-Antenna
- Page 428:
186 Chapter 5 • Multiple-Antenna
- Page 432:
188 Chapter 5 • Multiple-Antenna
- Page 436:
190 Chapter 5 • Multiple-Antenna
- Page 440:
192 Chapter 5 • Multiple-Antenna
- Page 444:
194 Chapter 5 • Multiple-Antenna
- Page 448:
196 Chapter 5 • Multiple-Antenna
- Page 452:
This page intentionally left blank
- Page 456:
200 Chapter 6 • Orthogonal Freque
- Page 460:
202 Chapter 6 • Orthogonal Freque
- Page 464:
204 Chapter 6 • Orthogonal Freque
- Page 468:
206 Chapter 6 • Orthogonal Freque
- Page 472:
208 Chapter 6 • Orthogonal Freque
- Page 476:
210 Chapter 6 • Orthogonal Freque
- Page 480:
212 Chapter 6 • Orthogonal Freque
- Page 484:
214 Chapter 6 • Orthogonal Freque
- Page 488:
216 Chapter 6 • Orthogonal Freque
- Page 492:
218 Chapter 6 • Orthogonal Freque
- Page 496:
220 Chapter 6 • Orthogonal Freque
- Page 500:
222 Chapter 6 • Orthogonal Freque
- Page 504:
224 Chapter 7 • Networking and Se
- Page 508:
226 Chapter 7 • Networking and Se
- Page 512:
228 Chapter 7 • Networking and Se
- Page 516:
230 Chapter 7 • Networking and Se
- Page 520:
232 Chapter 7 • Networking and Se
- Page 524:
234 Chapter 7 • Networking and Se
- Page 528:
236 Chapter 7 • Networking and Se
- Page 532:
238 Chapter 7 • Networking and Se
- Page 536:
240 Chapter 7 • Networking and Se
- Page 540:
242 Chapter 7 • Networking and Se
- Page 544:
244 Chapter 7 • Networking and Se
- Page 548:
246 Chapter 7 • Networking and Se
- Page 552:
248 Chapter 7 • Networking and Se
- Page 556:
250 Chapter 7 • Networking and Se
- Page 560:
252 Chapter 7 • Networking and Se
- Page 564:
254 Chapter 7 • Networking and Se
- Page 568:
256 Chapter 7 • Networking and Se
- Page 572:
258 Chapter 7 • Networking and Se
- Page 576:
260 Chapter 7 • Networking and Se
- Page 580:
262 Chapter 7 • Networking and Se
- Page 584:
264 Chapter 7 • Networking and Se
- Page 588:
266 Chapter 7 • Networking and Se
- Page 592:
268 Chapter 7 • Networking and Se
- Page 596:
This page intentionally left blank
- Page 600:
272 Chapter 8 • PHY Layer of WiMA
- Page 604:
274 Chapter 8 • PHY Layer of WiMA
- Page 608:
276 Chapter 8 • PHY Layer of WiMA
- Page 612:
278 Chapter 8 • PHY Layer of WiMA
- Page 616:
280 Chapter 8 • PHY Layer of WiMA
- Page 620:
282 Chapter 8 • PHY Layer of WiMA
- Page 624:
284 Chapter 8 • PHY Layer of WiMA
- Page 628:
286 Chapter 8 • PHY Layer of WiMA
- Page 632:
288 Chapter 8 • PHY Layer of WiMA
- Page 636:
290 Chapter 8 • PHY Layer of WiMA
- Page 640:
292 Chapter 8 • PHY Layer of WiMA
- Page 644:
294 Chapter 8 • PHY Layer of WiMA
- Page 648:
296 Chapter 8 • PHY Layer of WiMA
- Page 652:
298 Chapter 8 • PHY Layer of WiMA
- Page 656:
300 Chapter 8 • PHY Layer of WiMA
- Page 660:
302 Chapter 8 • PHY Layer of WiMA
- Page 664:
304 Chapter 8 • PHY Layer of WiMA
- Page 668:
This page intentionally left blank
- Page 672:
308 Chapter 9 • MAC Layer of WiMA
- Page 676:
310 Chapter 9 • MAC Layer of WiMA
- Page 680:
312 Chapter 9 • MAC Layer of WiMA
- Page 684:
314 Chapter 9 • MAC Layer of WiMA
- Page 688:
316 Chapter 9 • MAC Layer of WiMA
- Page 692:
318 Chapter 9 • MAC Layer of WiMA
- Page 696:
320 Chapter 9 • MAC Layer of WiMA
- Page 700:
322 Chapter 9 • MAC Layer of WiMA
- Page 704:
324 Chapter 9 • MAC Layer of WiMA
- Page 708:
326 Chapter 9 • MAC Layer of WiMA
- Page 712:
328 Chapter 9 • MAC Layer of WiMA
- Page 716:
330 Chapter 9 • MAC Layer of WiMA
- Page 720:
332 Chapter 9 • MAC Layer of WiMA
- Page 724:
This page intentionally left blank
- Page 728:
336 Chapter 10 • WiMAX Network Ar
- Page 732:
338 Chapter 10 • WiMAX Network Ar
- Page 736:
340 Chapter 10 • WiMAX Network Ar
- Page 740:
342 Chapter 10 • WiMAX Network Ar
- Page 744:
344 Chapter 10 • WiMAX Network Ar
- Page 748:
346 Chapter 10 • WiMAX Network Ar
- Page 752:
348 Chapter 10 • WiMAX Network Ar
- Page 756:
350 Chapter 10 • WiMAX Network Ar
- Page 760:
352 Chapter 10 • WiMAX Network Ar
- Page 764:
354 Chapter 10 • WiMAX Network Ar
- Page 768:
356 Chapter 10 • WiMAX Network Ar
- Page 772:
358 Chapter 10 • WiMAX Network Ar
- Page 776:
360 Chapter 10 • WiMAX Network Ar
- Page 780:
362 Chapter 10 • WiMAX Network Ar
- Page 784:
This page intentionally left blank
- Page 788:
366 Chapter 11 • Link-Level Perfo
- Page 792:
368 Chapter 11 • Link-Level Perfo
- Page 796:
370 Chapter 11 • Link-Level Perfo
- Page 800:
372 Chapter 11 • Link-Level Perfo
- Page 804:
374 Chapter 11 • Link-Level Perfo
- Page 808:
376 Chapter 11 • Link-Level Perfo
- Page 812:
378 Chapter 11 • Link-Level Perfo
- Page 816:
380 Chapter 11 • Link-Level Perfo
- Page 820:
382 Chapter 11 • Link-Level Perfo
- Page 824:
384 Chapter 11 • Link-Level Perfo
- Page 828:
386 Chapter 11 • Link-Level Perfo
- Page 832:
388 Chapter 11 • Link-Level Perfo
- Page 836:
390 Chapter 11 • Link-Level Perfo
- Page 840:
392 Chapter 11 • Link-Level Perfo
- Page 844:
394 Chapter 11 • Link-Level Perfo
- Page 848:
396 Chapter 11 • Link-Level Perfo
- Page 852:
398 Chapter 11 • Link-Level Perfo
- Page 856:
400 Chapter 11 • Link-Level Perfo
- Page 860:
402 Chapter 12 • System-Level Per
- Page 864:
404 Chapter 12 • System-Level Per
- Page 868:
406 Chapter 12 • System-Level Per
- Page 872:
408 Chapter 12 • System-Level Per
- Page 876:
410 Chapter 12 • System-Level Per
- Page 880:
412 Chapter 12 • System-Level Per
- Page 884:
414 Chapter 12 • System-Level Per
- Page 888:
416 Chapter 12 • System-Level Per
- Page 892:
418 Chapter 12 • System-Level Per
- Page 896:
420 Chapter 12 • System-Level Per
- Page 900:
422 Chapter 12 • System-Level Per
- Page 904:
424 Chapter 12 • System-Level Per
- Page 908:
426 Chapter 12 • System-Level Per
- Page 912:
428 Chapter 12 • System-Level Per
- Page 916:
430 AcronymsBRSBSBSCBSNBTSCBCCBRCCC
- Page 920:
432 AcronymsFFTFHDCFIBFIPSFIRFMFSHF
- Page 924:
434 AcronymsMMSEMNMPDUMPEGMPLSM-QAM
- Page 928:
436 AcronymsRSRSARSSRSSERSSIRSVPRTC
- Page 932:
438 AcronymsWANWAPWCDMAWCSWiBroWi-F
- Page 936:
440 Indexautomatic repeat requests
- Page 940:
442 IndexElectronics and Telecommun
- Page 944:
444 IndexLlabel switching routers (
- Page 948:
446 Indexpilot symbol, 130plaintext
- Page 952:
448 Indexstatistical channel model,