1 CHAPTER 1 INTRODUCTION 1.0 Overview Over ... - DSpace@UM
1 CHAPTER 1 INTRODUCTION 1.0 Overview Over ... - DSpace@UM
1 CHAPTER 1 INTRODUCTION 1.0 Overview Over ... - DSpace@UM
You also want an ePaper? Increase the reach of your titles
YUMPU automatically turns print PDFs into web optimized ePapers that Google loves.
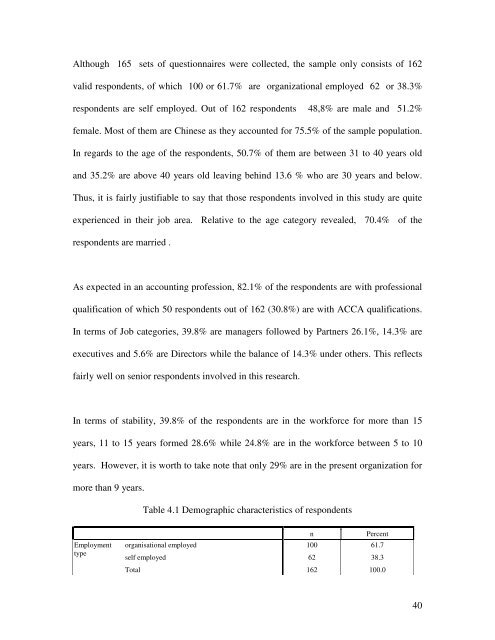
Although 165 sets of questionnaires were collected, the sample only consists of 162valid respondents, of which 100 or 61.7% are organizational employed 62 or 38.3%respondents are self employed. Out of 162 respondents 48,8% are male and 51.2%female. Most of them are Chinese as they accounted for 75.5% of the sample population.In regards to the age of the respondents, 50.7% of them are between 31 to 40 years oldand 35.2% are above 40 years old leaving behind 13.6 % who are 30 years and below.Thus, it is fairly justifiable to say that those respondents involved in this study are quiteexperienced in their job area. Relative to the age category revealed, 70.4% of therespondents are married .As expected in an accounting profession, 82.1% of the respondents are with professionalqualification of which 50 respondents out of 162 (30.8%) are with ACCA qualifications.In terms of Job categories, 39.8% are managers followed by Partners 26.1%, 14.3% areexecutives and 5.6% are Directors while the balance of 14.3% under others. This reflectsfairly well on senior respondents involved in this research.In terms of stability, 39.8% of the respondents are in the workforce for more than 15years, 11 to 15 years formed 28.6% while 24.8% are in the workforce between 5 to 10years. However, it is worth to take note that only 29% are in the present organization formore than 9 years.Table 4.1 Demographic characteristics of respondentsEmploymenttypenPercentorganisational employed 100 61.7self employed 62 38.3Total 162 100.040


