1 CHAPTER 1 INTRODUCTION 1.0 Overview Over ... - DSpace@UM
1 CHAPTER 1 INTRODUCTION 1.0 Overview Over ... - DSpace@UM
1 CHAPTER 1 INTRODUCTION 1.0 Overview Over ... - DSpace@UM

You also want an ePaper? Increase the reach of your titles
YUMPU automatically turns print PDFs into web optimized ePapers that Google loves.
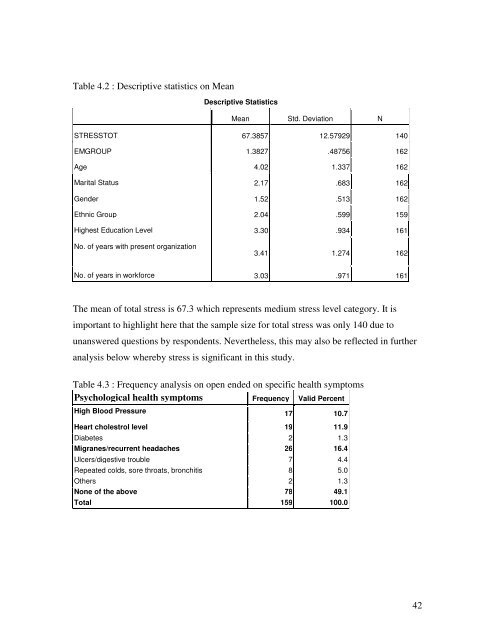
Table 4.2 : Descriptive statistics on MeanDescriptive StatisticsMean Std. Deviation NSTRESSTOT 67.3857 12.57929 140EMGROUP 1.3827 .48756 162Age 4.02 1.337 162Marital Status 2.17 .683 162Gender 1.52 .513 162Ethnic Group 2.04 .599 159Highest Education Level 3.30 .934 161No. of years with present organization3.41 1.274 162No. of years in workforce 3.03 .971 161The mean of total stress is 67.3 which represents medium stress level category. It isimportant to highlight here that the sample size for total stress was only 140 due tounanswered questions by respondents. Nevertheless, this may also be reflected in furtheranalysis below whereby stress is significant in this study.Table 4.3 : Frequency analysis on open ended on specific health symptomsPsychological health symptoms Frequency Valid PercentHigh Blood Pressure 17 10.7Heart cholestrol level 19 11.9Diabetes 2 1.3Migranes/recurrent headaches 26 16.4Ulcers/digestive trouble 7 4.4Repeated colds, sore throats, bronchitis 8 5.0Others 2 1.3None of the above 78 49.1Total 159 100.042