Satellite detection of hazardous volcanic clouds and ... - Savaa - NILU
Satellite detection of hazardous volcanic clouds and ... - Savaa - NILU
Satellite detection of hazardous volcanic clouds and ... - Savaa - NILU

Create successful ePaper yourself
Turn your PDF publications into a flip-book with our unique Google optimized e-Paper software.
Nat HazardsDOI 10.1007/s11069-008-9273-zORIGINAL PAPER<strong>Satellite</strong> <strong>detection</strong> <strong>of</strong> <strong>hazardous</strong> <strong>volcanic</strong> <strong>clouds</strong><strong>and</strong> the risk to global air trafficA. J. PrataReceived: 9 February 2008 / Accepted: 13 June 2008Ó Springer Science+Business Media B.V. 2008Abstract Remote sensing instruments have been used to identify, track <strong>and</strong> in somecases quantify atmospheric constituents from space-borne platforms for nearly 30 years.These data have proven to be extremely useful for detecting <strong>hazardous</strong> ash <strong>and</strong> gas(principally SO 2 ) <strong>clouds</strong> emitted by volcanoes <strong>and</strong> which have the potential to intersectglobal air routes. The remoteness <strong>of</strong> volcanoes, the sporadic timings <strong>of</strong> eruptions <strong>and</strong> theability <strong>of</strong> the upper atmosphere winds to quickly spread ash <strong>and</strong> gas, make satellite remotesensing a key tool for developing hazard warning systems. It is easily recognized howpowerful these tools are for hazard <strong>detection</strong> <strong>and</strong> yet there has not been a single instrumentdesigned specifically for this use. Instead, researchers have had to make use <strong>of</strong> instruments<strong>and</strong> data designed for other purposes. In this article the satellite instruments, algorithms<strong>and</strong> techniques used for ash <strong>and</strong> gas <strong>detection</strong> are described from a historical perspectivewith a view to elucidating their value <strong>and</strong> shortcomings. Volcanic <strong>clouds</strong> residing in themid- to upper-troposphere (heights above 5 km) have the greatest potential <strong>of</strong> intersectingair routes <strong>and</strong> can be dispersed over many 1,000s <strong>of</strong> kilometres by the prevailing winds.Global air traffic vulnerability to the threat posed by <strong>volcanic</strong> <strong>clouds</strong> is then consideredfrom the perspectives <strong>of</strong> satellite remote sensing, the upper troposphere mean windcirculation, <strong>and</strong> current <strong>and</strong> forecast air traffic density based on an up-to-date aircraftemissions inventory. It is concluded that aviation in the Asia Pacific region will beincreasingly vulnerable to <strong>volcanic</strong> cloud encounters because <strong>of</strong> the large number <strong>of</strong> activevolcanoes in the region <strong>and</strong> the increasing growth rate <strong>of</strong> air traffic in that region. It is alsonoted that should high-speed civil transport (HSCT) aircraft become operational, there willbe an increased risk to <strong>volcanic</strong> debris that is far from its source location. This vulnerabilityis highlighted using air traffic density maps based on NOx emissions <strong>and</strong> satellite SO 2observations <strong>of</strong> the spread <strong>of</strong> <strong>volcanic</strong> <strong>clouds</strong>.KeywordsHazardous <strong>volcanic</strong> <strong>clouds</strong> Global air traffic risk <strong>Satellite</strong> measurementsA. J. Prata (&)Norwegian Institute for Air Research, P.O. Box 100, 2027 Kjeller, Norwaye-mail: fpr@nilu.no123
Nat Hazards1 IntroductionThe unpredictability <strong>of</strong> <strong>volcanic</strong> eruptions (both in timing <strong>and</strong> in location) have led tomany disasters. In modern historical times, catastrophes due to <strong>volcanic</strong> eruptions can befound in the literature, in some cases causing social, economic <strong>and</strong> political upheaval. Untilthe last 60 years or so, major hazards due to <strong>volcanic</strong> eruptions have been localized withinthe region surrounding the eruption. The most far-reaching effects have come from largeeruptions which can disrupt the Earth’s climate system on the time-scale <strong>of</strong> years. With theadvent <strong>of</strong> inter-continental passenger jet travel, a new hazard from <strong>volcanic</strong> eruptions hasemerged. Volcanic eruptions can inject large quantities <strong>of</strong> <strong>volcanic</strong> ash <strong>and</strong> gases into theatmosphere at heights that range from the summit <strong>of</strong> the volcano to as high as 50 km in themost energetic eruptions (e.g. Pinatubo, Philippines, 15.13° N, 20.35° E, 10–15 June,1991). Once al<strong>of</strong>t, winds can transport the ash <strong>and</strong> gases rapidly <strong>and</strong> in multiple directionswhich depend on the wind speed <strong>and</strong> wind shear (the change in wind direction with height).Within the jet stream, wind speeds may reach 100 m s -1 (360 km hr -1 ) so that transportover long distances in just a few hours is possible. The ash can cause extensive damage toaircraft, stalling engines, abrading windscreens <strong>and</strong> damaging sensitive avionics equipment(Casadevall 1994; Casadevall et al. 1996). Volcanic gases, specifically SO 2 may also posea hazard to aircraft, <strong>and</strong> because gas <strong>and</strong> ash have different specific gravities they mayseparate <strong>and</strong> travel at different speeds <strong>and</strong> different heights in a sheared atmosphere(Holasek et al. 1996).Coupled with the problem <strong>of</strong> forecasting the onset <strong>of</strong> eruptions <strong>and</strong> tracking theirmovement, is the difficulty <strong>of</strong> discriminating <strong>hazardous</strong> <strong>volcanic</strong> <strong>clouds</strong> from more commonmeteorological <strong>clouds</strong>. Even with the full knowledge <strong>of</strong> a <strong>volcanic</strong> eruption inprogress, airline authorities do not have sufficient information to be able to confidentlyensure the safety <strong>of</strong> jet aircraft. The logistical challenges faced by the airline industry arelarge: there are more than 70 volcanoes known to be active at present, eruptions occur onaverage about once per week somewhere over the globe, the eruptions are unpredictable,most volcanoes are remote <strong>and</strong> not routinely monitored, <strong>volcanic</strong> <strong>clouds</strong> can spread morethan 1,000 km in less than 3 h <strong>and</strong> on board <strong>detection</strong> <strong>of</strong> these <strong>hazardous</strong> <strong>clouds</strong> is notcurrently possible (aircraft radar cannot detect micron size particles or gases). The currentglobal airline fleet consists <strong>of</strong> about 18,000 aircraft <strong>and</strong> there is an increasing trend towards2-engine jets, away from 4-engine aircraft. This is an important aspect in the assessment <strong>of</strong>aircraft safety as the ash directly affects the engines, causing them to stall. Having fewerengines exacerbates the risk <strong>of</strong> total loss <strong>of</strong> power <strong>and</strong> consequent disaster. Anotherdevelopment <strong>of</strong> concern is the proposed introduction <strong>of</strong> high-speed civil transport (HSCT)aircraft that will cruise at altitudes <strong>of</strong> 20 km or so. At these altitudes, as we shall see, thereis greater likelihood <strong>of</strong> an encounter with <strong>volcanic</strong> debris far from its source. Forecastssuggest fleets <strong>of</strong> up to 1,000 HSCT aircraft may be operating by 2015 (Wei et al. 2001).<strong>Satellite</strong>-based information provides a valuable asset to airline operations <strong>and</strong> this hasbeen recognized for some time (Sawada 1987; Miller <strong>and</strong> Casadevall 1999). Initially,weather satellite data were used to monitor the movement <strong>of</strong> ash <strong>clouds</strong>, but later it wasfound that a combination <strong>of</strong> certain infrared channels could be used to discriminate ash<strong>clouds</strong> from meteorological <strong>clouds</strong> (Prata 1989a, b). Since these early discoveries <strong>and</strong> withsatellite instrument technology advances, new <strong>and</strong> improved systems have been developedfor ash <strong>detection</strong> <strong>and</strong> monitoring. These systems have also been applied to detect <strong>volcanic</strong>SO 2 gas. In this article we provide an overview <strong>of</strong> the advances made in utilizing satellitebasedtechniques for <strong>volcanic</strong> ash <strong>and</strong> gas <strong>detection</strong> <strong>and</strong> monitoring.123
Nat HazardsThe article is organized as follows: we begin with a brief historical overview, reachingback 30 years to the start <strong>of</strong> the meteorological satellite era <strong>and</strong> describing how satelliteinstruments have been used to monitor <strong>and</strong> detect <strong>hazardous</strong> <strong>volcanic</strong> <strong>clouds</strong>. Next, themain techniques <strong>and</strong> progress made with satellite ash <strong>detection</strong> is presented, followed by asimilar discussion for SO 2 <strong>detection</strong>. A threat analysis, based on the mean wind circulation<strong>and</strong> a proxy for air traffic density is developed to look at global <strong>and</strong> regional aviationvulnerabilities to <strong>hazardous</strong> <strong>volcanic</strong> <strong>clouds</strong>. Finally, some conclusions are made regardingthe way that satellite data can be used to assist the aviation industry avoid <strong>hazardous</strong><strong>volcanic</strong> <strong>clouds</strong>.2 Historical overviewSawada (1987) was the first person to provide a methodological survey <strong>of</strong> <strong>volcanic</strong> ash<strong>clouds</strong> <strong>and</strong> plumes using satellite imagery. He made use <strong>of</strong> geosynchronous weathersatellite imagery (the Geostationary Meteorological <strong>Satellite</strong>—GMS 1 ) to document <strong>volcanic</strong>eruptions <strong>and</strong> ash cloud dispersion within the western Pacific region. Sawada (1996)found that the <strong>detection</strong> rate from GMS imagery was about 13.7% <strong>of</strong> all known eruptionsduring the period late 1977–1985. This apparent low <strong>detection</strong> rate is attributed to theinterference from meteorological <strong>clouds</strong>. Restrictions on the spatial (<strong>clouds</strong> smaller thanabout 5 km were not detectable) <strong>and</strong> spectral sampling (only single visible <strong>and</strong> infraredchannels were available from GMS) also contributed to the low <strong>detection</strong> rate. Malingreau<strong>and</strong> Kasw<strong>and</strong>a (1986) used satellite imagery (AVHRR) to study the Colo, Indonesiaeruption <strong>of</strong> 28 July, 1983, which is also known to have caused problems for jet aircraftoperating in the region. Hanstrum <strong>and</strong> Watson (1983) studied the April, 1992 Galunggung,Indonesia eruptions from a meteorological perspective <strong>and</strong> noted the usefulness <strong>of</strong> satellitedata in detecting ash plumes. Krueger (1983), Krueger et al. (1995) <strong>and</strong> Krueger et al.(2000) have shown that ultra-violet measurements from TOMS, designed to measureozone, could be used to track <strong>volcanic</strong> SO 2 <strong>clouds</strong>. Carn et al. (2004) has shown thatTOMS could also be used to measure man-made SO 2 emissions.The theoretical basis for using infrared satellite imagery to discriminate <strong>volcanic</strong> ash<strong>clouds</strong> from meteorological <strong>clouds</strong> was provided in articles by Prata (1989a, b), <strong>and</strong> laterextended by Wen <strong>and</strong> Rose (1994). The original method proposed by Prata (1989a) orvariants <strong>of</strong> it are in use today by the Volcanic Ash Advisory Centres (VAACs). Themethod relies on taking the difference between two images acquired at two slightlydifferent wavelengths within the infrared window, between 8 <strong>and</strong> 12 lm. Ash <strong>clouds</strong> arecomposed mostly <strong>of</strong> silicate particles <strong>and</strong> these absorb, scatter <strong>and</strong> re-emit infrared radiationin a different manner to ice <strong>and</strong> water, the main components <strong>of</strong> meteorological‘weather’ <strong>clouds</strong>. This important difference allows a discrimination between <strong>clouds</strong>composed mostly <strong>of</strong> ash <strong>and</strong> those composed mostly <strong>of</strong> water <strong>and</strong> ice. When mixturesoccur, as they invariably do in the turbulent atmosphere, the ability to discriminate isproportionally reduced, or in some instances rendered ineffective, for example when theash particles are completely coated by ice (Rose et al. 1995). Despite some shortcomings<strong>of</strong> this ‘‘reverse absorption’’ technique, it remains the most effective means <strong>of</strong> detecting<strong>and</strong> discriminating <strong>volcanic</strong> ash <strong>clouds</strong> from satellite imagery.In t<strong>and</strong>em with the developments <strong>of</strong> infrared satellite techniques, researchers had foundthat the ultra-violet portion <strong>of</strong> the electromagnetic spectrum could also be applied to the1 See the Appendix for a full list <strong>of</strong> all acronyms used in this article.123
Nat Hazardsstudy <strong>of</strong> <strong>volcanic</strong> <strong>clouds</strong>. Krueger (1983) was the first to recognize the usefulness <strong>of</strong>satellite UV measurements for studying the spread <strong>of</strong> SO 2 in the eruption <strong>clouds</strong> from ElChichon, Mexico in 1982. He used TOMS UV imagery to show the movement <strong>of</strong> the SO 2<strong>clouds</strong> around the globe. Originally designed to measure ozone, TOMS has now beenproviding <strong>detection</strong>s <strong>of</strong> global <strong>volcanic</strong> SO 2 <strong>clouds</strong> for almost 30 years.The principles behind using UV to measure <strong>and</strong> quantify <strong>volcanic</strong> substances (both SO 2<strong>and</strong> <strong>volcanic</strong> ash can be identified) are described by Krueger et al. (1995) for the TOMSinstrument <strong>and</strong> more recently by Krotkov et al. (2006) for the Ozone Monitoring Instrument(OMI). The SO 2 retrievals rely on the use <strong>of</strong> backscattered solar ultra-violet radiationthat is preferentially affected by b<strong>and</strong>s <strong>of</strong> SO 2 in the 280–320 nm wavelength range. Theuse <strong>of</strong> multiple b<strong>and</strong>s permits separation <strong>of</strong> some <strong>of</strong> the confounding effects due to othermolecules (e.g. O 3 ), reflections <strong>of</strong>f the surface, Rayleigh multiple scattering <strong>and</strong> absorptionby aerosols <strong>and</strong> <strong>clouds</strong>. Volcanic ash is detected by calculating an aerosol absorbing index(e.g. Torres et al. 1998) based on a ratio <strong>of</strong> two b<strong>and</strong>s. Although this technique does notdiscriminate ash from other absorbing aerosols, the context <strong>of</strong> the measurements is usuallysufficient to infer that ash is the aerosol responsible for the absorption.Visible light has also been used to infer the presences <strong>of</strong> <strong>volcanic</strong> debris in the atmosphere.Matson (1984) used GOES <strong>and</strong> NOAA AVHRR satellite data <strong>and</strong> Richardson(1984) used NOAA AVHRR satellite data to measure the change in transparency <strong>of</strong> theatmosphere due to the eruption <strong>clouds</strong> <strong>of</strong> El Chichon.These early attempts at utilizing satellite imagery in studying <strong>volcanic</strong> <strong>clouds</strong> wererefined <strong>and</strong> improved after the major eruptions <strong>of</strong> Pinatubo, Philippines in June 1991. Morethan 30 cases <strong>of</strong> ash/aircraft encounters have been documented (Casadevall et al. 1996)<strong>and</strong> the mainly logistical problem <strong>of</strong> providing timely warnings to aircraft becameapparent. Following the problems from this eruption, a network <strong>of</strong> ash advisory centres(VAACs) was set up, with nodes at Darwin, Australia, Tokyo, Japan, Anchorage, Alaska,Buenos Aires, Argentina, Montreal, Canada, Toulouse, France, Washington DC, USA <strong>and</strong>London, Engl<strong>and</strong>. The VAACs provide advisories for their regions <strong>of</strong> responsibility <strong>and</strong>these cover the majority <strong>of</strong> the globe <strong>and</strong> include all the major air-routes. The operations <strong>of</strong>the VAACs are improving all the time—with the advent <strong>of</strong> satellite instruments with betterspatial, temporal <strong>and</strong> spectral resolutions, <strong>and</strong> greatly improved data delivery services,much <strong>of</strong> the focus has moved from a reactive mode to a forecasting <strong>and</strong> pre-emptive mode.The forecasting <strong>of</strong> dispersing ash <strong>clouds</strong> has become a major activity <strong>of</strong> research <strong>and</strong> isdiscussed elsewhere in this issue. Logistical problems <strong>and</strong> operations at VAACs <strong>and</strong> atairports are also <strong>of</strong> major importance <strong>and</strong> are discussed by Guffanti <strong>and</strong> Albersheim(2008). Here we focus on satellite <strong>detection</strong> <strong>of</strong> <strong>volcanic</strong> <strong>clouds</strong>.3 Volcanic ash <strong>detection</strong> from satellitesThe problem <strong>of</strong> detecting <strong>volcanic</strong> <strong>clouds</strong> from satellites is really a problem <strong>of</strong> discrimination.Clouds absorb, emit <strong>and</strong> scatter radiation in the visible, infrared <strong>and</strong> microwaveregions <strong>of</strong> the electromagnetic spectrum. At visible wavelengths, depending on thegeometry <strong>of</strong> illumination (by the Sun or using a laser light source) <strong>and</strong> the geometry <strong>of</strong>observation, <strong>clouds</strong> may appear bright or dark. This is true <strong>of</strong> <strong>clouds</strong> <strong>of</strong> water, ice, silicates(<strong>volcanic</strong> ash), wind-blown dust (desert dust), smoke (e.g. from a large forest fire) or anyother naturally or anthropogenically generated cloud <strong>of</strong> particles. It is sometimes very clearthat a particular cloud is meteorological in origin (for example, a cloud <strong>of</strong> water droplets orice particles, or a mixed phase cloud), but <strong>of</strong>ten not so clear that it is not a meteorological123
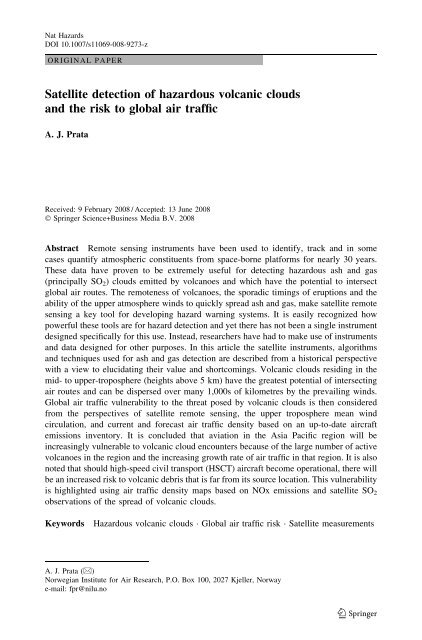
Nat Hazardscloud. Figure 1a–h shows some satellite images <strong>of</strong> <strong>clouds</strong> <strong>and</strong> aerosols in the atmosphere.These are daytime MODIS images that have been enhanced to provide a ‘‘true-colour’’rendition <strong>of</strong> the scene. In all scenes there are meteorological <strong>clouds</strong> <strong>and</strong> <strong>clouds</strong> due to otherFig. 1 Daytime MODIS scenes showing ‘‘anomalous’’ <strong>clouds</strong>. (a) Thick ash column from Ruang volcano,(b) drifting ash <strong>and</strong> gas plumes from Karthala volcano, (c) low-level gas cloud plume, (d) ash <strong>and</strong> gas plumeover snow-covered terrain (Kluichevskoi volcano), (e) ash <strong>and</strong> gas plume from Kluichevskoi during thesummer, (f) a noxious gas cloud from an industrial fire in southern Engl<strong>and</strong>, (g) a dust outbreak over theCanary isl<strong>and</strong>s <strong>and</strong> (h) wind-blown ash streaming <strong>of</strong>f the southern coast <strong>of</strong> Icel<strong>and</strong>123
Nat Hazardssources: (a) a thick ash column rising above Ruang volcano (Sangihie isl<strong>and</strong>s, Indonesia,125.37° E, 2.30° N), (b) a drifting ash <strong>and</strong> gas plume recently emitted from Karthalavolcano, Comoros (11.75°S, 43.38° E), (c) a low-level gas (predominantly SO 2 <strong>and</strong> H 2 O)from Ambrym volcano, Vanuatu (16.25°S, 168.12° E), (d) an ash <strong>and</strong> gas plume oversnow-covered terrain from Kluchevskoi volcano, Kamchatka (56.057° N, 160.638° E),(e) an ash <strong>and</strong> gas plume from Kluchevskoi, but in the summer, (f) a noxious cloudgenerated from an industrial accident in southern Engl<strong>and</strong>, (g) a dust outbreak travellingwestwards over the Canary Isl<strong>and</strong>s (28.00° N, 15.58° W) <strong>and</strong> (h) wind-blown ash <strong>of</strong>f thecoast <strong>of</strong> Icel<strong>and</strong>. These examples illustrate some <strong>of</strong> the variability found in anomalous<strong>clouds</strong> when viewed by satellites during the day. Some <strong>clouds</strong> appear almost black(Fig. 1f) or dark grey (Fig. 1h), some are as white as water/ice <strong>clouds</strong> (Fig. 1c <strong>and</strong> d),whilst others take various s<strong>and</strong>y shades with brown <strong>and</strong> yellow hues (Fig. 1a, b, e <strong>and</strong> g).By using objective analysis <strong>of</strong> daytime visible imagery alone, it has been very difficult tounambiguously discriminate ash <strong>clouds</strong> from other <strong>clouds</strong>. During the nighttime, the task ismade even more difficult. This is the main reason why infrared data has proven to be <strong>of</strong>great use. There are now several ash <strong>detection</strong> algorithms in use or proposed, based on IR<strong>and</strong> visible satellite data. Table 1 shows a summary <strong>of</strong> ash <strong>detection</strong> schemes (with originalreferences), based mostly on using infrared channels.The two channel, reverse absorption technique is very useful in cases where the ash isnot too thick <strong>and</strong> not too dispersed <strong>and</strong> is used at the VAACs (Watkin 2003). Figure 2shows an application <strong>of</strong> the technique for the eruption <strong>of</strong> Karthala (Fig. 1b). In this case,the ash hazard is depicted using shades <strong>of</strong> yellow to red, with red suggesting more denseash <strong>and</strong> greater hazard. Note that the white coloured <strong>clouds</strong> seen in the true colour image(Fig. 1b) <strong>of</strong> this event are not detected as an ash hazard. But note too that the edges <strong>of</strong>several <strong>clouds</strong> are detected as a potential ash hazard, whereas it seems more likely thatthese are meteorological <strong>clouds</strong>. The problems <strong>and</strong> pitfalls <strong>of</strong> using the reverse absorptiontechnique have been discussed in the research literature (e.g. Simpson et al. 2000; Prataet al. 2001) <strong>and</strong> are well known to experienced meteorological analysts. Context is a keyelement in determining whether a particular cloud is an ash hazard or not, <strong>and</strong> trainedmeteorologists tasked with identifying ash <strong>clouds</strong> will use multiple sources <strong>of</strong> informationincluding satellite imagery, pilot reports, ground observer reports, wind trajectories <strong>and</strong>background information regarding regional <strong>volcanic</strong> activity <strong>and</strong> prior behaviour.Table 1 Summary <strong>of</strong> ash <strong>detection</strong> algorithms <strong>and</strong> techniques used with satellite infrared (IR) <strong>and</strong> visiblechannel dataName Principle ReferenceRA 2-b<strong>and</strong> IR (11 <strong>and</strong> 12 lm) Prata (1989a, b)Ratio 2-b<strong>and</strong> IR (11 <strong>and</strong> 12 lm) Holasek <strong>and</strong> Rose (1991)4-b<strong>and</strong> IR + visible Mosher (2000)TVAP 3-b<strong>and</strong> IR (3.9, 11 <strong>and</strong> 12 lm) Ellrod et al. (2003)PCI Multi-b<strong>and</strong> principal components Hillger <strong>and</strong> Clark (2002a, b)WVC 2-b<strong>and</strong> IR + water vapour correction Yu et al. (2002)RAT 3-b<strong>and</strong> IR (3.5, 11, 12 lm) Pergola et al. (2004)3-b<strong>and</strong> 3-b<strong>and</strong> (IR <strong>and</strong> visible) Pavolonis et al. (2006)RA = Reverse absorption; TVAP = Three b<strong>and</strong> <strong>volcanic</strong> ash product; PCI = Principle components;RAT = Ratio method; WVC = Water vapor correction method123
Nat HazardsFig. 2 An ash ‘‘risk’’ map for the Karthala eruption shown in Fig. 1b, based on the reverse absorptiontechnique using two infrared channels. Regions <strong>of</strong> greatest risk are coloured red. Grey regions are believedto be ‘‘ash free’’It is possible to take the infrared analysis one step further. Wen <strong>and</strong> Rose (1994) <strong>and</strong>Prata <strong>and</strong> Grant (2001) have shown that by including a microphysical model <strong>of</strong> the ashparticles with a detailed radiative transfer model, the infrared data can be inverted to revealmean particle size <strong>and</strong> cloud opacity. When these parameters are integrated over the areacovered by the cloud, the total mass <strong>and</strong> mass loading can be inferred from the data. Theseare quantifiable products that may be incorporated with dispersion models to generate riskmaps for use by the aviation industry. An example <strong>of</strong> this kind <strong>of</strong> retrieval is given inFig. 3, also for the Karthala eruption. There are many satellites (polar <strong>and</strong> geosynchronous)that carry these infrared channels, so this product can be delivered globally. Table 2 givesdetails <strong>of</strong> some <strong>of</strong> the satellite instruments capable <strong>of</strong> providing ash mass loadings.Two <strong>of</strong> the instruments listed in Table 2 are capable <strong>of</strong> measuring much more than ashmass loadings. These instruments, AIRS (Chahine et al. 2006) <strong>and</strong> IASI (Clerbaux et al.2007) have high spectral resolution <strong>and</strong> by utilizing more measurement channels it may be123
Nat HazardsFig. 3 Ash mass loading retrievals for the Karthala eruption shown in Fig. 1bTable 2 Details <strong>of</strong> past <strong>and</strong> current satellite instruments that can be used to detect ash <strong>and</strong> generate ashmass loading maps from infrared measurements<strong>Satellite</strong> Instrument Spatial resolution(km 9 km)Temporal resolution(per day)Time periodcovered (present)NOAA AVHRR-2, -3 1 9 1 2 1981NOAA HIRS-2, -3, -4 10 9 10 a 2 1979GOES VISSR/VAS 5 9 5 24 1980ENVISAT ATSR-family 1 9 1 2 b 1991GMS-5 VISSR 5 9 5 24 1995Terra/Aqua MODIS 1 9 1 4 c 1999Aqua AIRS 14 9 14 2 2002MetOp IASI 12 9 12 2 2007MSG SEVIRI 3 9 3 96 2006a Earlier HIRS (1–3) instruments had a larger field <strong>of</strong> view <strong>of</strong> 18 9 18 km 2b These satellite are in a 3-day repeat cycle, such that the same point imaged twice in one day will not beimaged again until 3 days laterc Assuming two satellites in orbit at any given timepossible to infer something about the mineralogy <strong>of</strong> the ash. Indeed it may also be possibleto discriminate dust (Fig. 1g) <strong>and</strong> wind-blown ash (Fig. 1h) outbreaks from <strong>volcanic</strong> asheruption <strong>clouds</strong> <strong>and</strong> plumes.There remains some difficulty in identifying <strong>hazardous</strong> ash under many circumstances,<strong>and</strong> timeliness is still an issue. A further complication is that there is no st<strong>and</strong>ard satellitebasedproduct providing ash cloud height. This vital piece <strong>of</strong> information is usually123
Nat Hazardsinferred later. Once a sequence <strong>of</strong> images has revealed the spatial <strong>and</strong> temporal behaviour<strong>of</strong> the ash cloud, trajectories are run based on ‘‘guessed’’ heights <strong>and</strong> the best fit is used toestablish the most likely height <strong>of</strong> the <strong>hazardous</strong> ash cloud. This ‘‘hit <strong>and</strong> miss’’ methodologyhas recently been put on a firm theoretical basis by Eckhardt et al. (2008) who usean inverse modelling technique that combines Langrangian particle dispersion using windfields with satellite measurements to estimate the injection height pr<strong>of</strong>ile <strong>of</strong> the eruption.The method has been tested on the eruption <strong>of</strong> Jebel at Tair, Yemen (15.55° N, 41.83° E)<strong>and</strong> relied on SO 2 satellite measurements from SEVIRI as a proxy for ash. The result wasvery good <strong>and</strong> independent validation against OMI <strong>and</strong> a spaced-based lidar (CALIPSO)showed that once the injection height was known accurately (±1 km) the trajectory <strong>and</strong>dispersion <strong>of</strong> the cloud could be faithfully tracked for several days <strong>and</strong> over more than10,000 km. The idea <strong>of</strong> using SO 2 satellite measurements to infer the ash hazard is notnew; but there are problems with this approach <strong>and</strong> ideally it would be better to use directash measurements. At the current time, satellite SO 2 measurements are easier to make <strong>and</strong>have proven to be very useful for aviation hazard warnings. The following sectiondiscusses the state <strong>of</strong> the science <strong>of</strong> SO 2 <strong>detection</strong> from space.4 SO 2 <strong>detection</strong> from satellitesSulphur dioxide is, typically, the third most abundant gas (after water vapour <strong>and</strong> CO 2 )emitted by volcanoes. It is a colourless gas that can cause eye irritation, breathing difficulties<strong>and</strong> death when encountered in high concentrations. The background atmospherecontains very little SO 2 —most anthropogenic emissions arise from industrial sources,whilst natural emissions are dominated by <strong>volcanic</strong> sources. Low-level SO 2 <strong>volcanic</strong>emissions (<strong>of</strong>ten referred to as passive degassing) are <strong>of</strong> little concern to aviation. Duringexplosive eruption episodes, SO 2 may be violently injected into the atmosphere <strong>and</strong> mayreach higher altitudes where they intercept the airways <strong>and</strong> potentially become a hazard toaviation. It is not clear exactly what threat SO 2 emissions pose to aircraft, however it isgenerally assumed that the emissions will be accompanied by ash, which is a known hazard.Consequently, pilots are trained to recognize the acrid odour generated by sulphur gases(SO 2 <strong>and</strong> H 2 S both have characteristic pungent odours) so that they may infer that anencounter with a <strong>volcanic</strong> cloud has taken place. This may not mean that ash has beenencountered—there are other tell-tale signs for an ash encounter—but the current proceduresdem<strong>and</strong> that if an encounter is suspected it should be noted, reported <strong>and</strong> any remedialmaintenance checks carried out. It is possible that SO 2 , in sufficiently high concentrations,could cause fuel contamination, <strong>and</strong> if encountered as sulphuric acid aerosol, it is believedthat airframe <strong>and</strong> window damage could also occur (Bernard <strong>and</strong> Rose 1984). Under theassumption that <strong>volcanic</strong> SO 2 in the upper troposphere (above 5 km) travels with <strong>volcanic</strong>ash, it is sensible to use satellite measurements <strong>of</strong> SO 2 as a proxy for ash.Since 1979, SO 2 has been measured by the TOMS instrument, designed to measureatmospheric ozone, on board several different polar-orbiting satellites. The measurementsrely on scattered solar UV radiation, which is affected by the presence <strong>of</strong> SO 2 at wavelengthsbetween 0.28 <strong>and</strong> 0.32 lm. The large footprint size (50 9 50 km 2 ), once per daycoverage <strong>and</strong> relatively low signal-to-noise ratio for TOMS SO 2 measurements meant thatonly SO 2 <strong>clouds</strong> from the larger (VEI [ 2) eruptions could be detected. Nevertheless,TOMS has proved to be very useful for tracking SO 2 <strong>clouds</strong>, <strong>and</strong> for verifying the <strong>volcanic</strong>origin <strong>of</strong> ‘‘anomalous’’ <strong>clouds</strong>. Good examples showing the collocation <strong>of</strong> SO 2 <strong>and</strong> ash<strong>clouds</strong> can be found in Schneider et al. (1999) <strong>and</strong> Constantine et al. (2000).123
Nat HazardsTable 3 Details <strong>of</strong> past <strong>and</strong> current satellite instruments that can be used to detect <strong>and</strong> quantify SO 2 usingUV <strong>and</strong> IR measurements<strong>Satellite</strong> Instrument Spatial resolution(km 9 km)Temporal resolution(per day)Time periodcovered (present)Various TOMS 50 9 50 1 1979NOAA HIRS-2, -3, -4 10 9 10 a 2 1979GOES VISSR/VAS 5 9 5 24 1980Terra/Aqua MODIS 1 9 1 4 b 1999Terra ASTER 0.09 9 0.09 1/16 1999Aqua AIRS 14 9 14 2 2002Aura OMI 24 9 13 1 2004Aura MLS 30 9 150 1 2004ERS-2 GOME 320 9 40 1 1995ENVISAT SCIAMACHY 60 9 30 1 2002MetOp IASI 12 9 12 2 2007MetOp GOME-2 80 9 40 2 2007MSG SEVIRI 3 9 3 96 2006a Earlier HIRS (1–3) instruments had a larger field <strong>of</strong> view <strong>of</strong> 18 9 18 km 2b Assuming two satellites in orbit at any given timeThe success <strong>of</strong> TOMS for detecting SO 2 using UV measurements has led to thedevelopment <strong>of</strong> improved instruments such as GOME, SCIAMACHY, OMI <strong>and</strong> GOME-2.The methods used for SO 2 <strong>detection</strong> are given by Eisinger <strong>and</strong> Burrows (1998) <strong>and</strong>Thomas et al. (2004) for GOME, by Richter et al. (2006) for SCIAMACHY <strong>and</strong> byKrotkov et al. (2006) for OMI. All <strong>of</strong> these instruments are in polar orbit <strong>and</strong> have, at best,spatial resolutions <strong>of</strong> 14 9 24 km 2 (OMI) <strong>and</strong> are restricted to coverage <strong>of</strong> the sunlit part<strong>of</strong> the Earth. GOME-2 <strong>and</strong> SCIAMACHY data are used to generate a global SO 2 alert forboth natural (<strong>volcanic</strong>) <strong>and</strong> anthropogenic emissions (Van Geffen et al. (2007), see alsohttp://www.oma.be/BIRA-IASB/Molecules/SO2nrt/) <strong>and</strong> a similar system is underconstruction for OMI.SO 2 can also be measured using infrared radiation (Prata et al. 2003), with loweraccuracy <strong>and</strong> precision than by using UV radiation. Polar-orbiting <strong>and</strong> geosynchronoussatellite instruments exist with infrared channels that can be used to infer SO 2 columnabundances. <strong>Satellite</strong> instruments starting in 1979 that can be used to measure SO 2 columnamount include: HIRS, VISSR, MODIS, AIRS, SEVIRI <strong>and</strong> IASI. 2 Since all <strong>of</strong> thesesatellite data can be used during the night just as well as during the day, <strong>and</strong> because theygenerally have better spatial resolutions (up to 1 km 2 ), they also <strong>of</strong>fer the possibility <strong>of</strong>developing a global SO 2 alert system. The main details regarding the UV <strong>and</strong> IR instrumentsfor SO 2 <strong>detection</strong> are summarized in Table 3.There have been many examples <strong>of</strong> the extensive spread <strong>of</strong> SO 2 from <strong>volcanic</strong> eruptionsdetected by both UV <strong>and</strong> IR satellite sensors. Notable amongst these are El Chichon(17.360° N, 92.228° W) in 1982 (Krueger 1983), Mt Spurr (61.299° N, 152.251° W) in1989 (Schneider et al. 1995), Pinatubo in 1991 (Bluth et al. 1993; Prata et al. 2003) <strong>and</strong>Hudson (45.90° S, 72.97° W) in 1991 (Barton et al. 1992). More recently, OMI <strong>and</strong> AIRS2 ASTER can also be used to detect <strong>volcanic</strong> SO 2 (e.g. Urai 2004), but its long re-visit time (16 days) <strong>and</strong>narrow swath width (*60 km) make it less useful for global aviation threat monitoring.123
Nat Hazardsmeasurements have tracked <strong>clouds</strong> <strong>of</strong> SO 2 generated by eruptions from Soufriere Hills,Montserat (16.72° N, 62.18° W) (Carn et al. 2007; Prata et al. 2007) <strong>and</strong> Jebel at Tair,Yemen (Eckhardt et al. 2008). These SO 2 <strong>clouds</strong> could be tracked for several weeks asthey travelled with the prevailing winds at heights greater than 15 km. At these heights theSO 2 <strong>clouds</strong> were above commercial jet aircraft traffic <strong>and</strong> posed little threat to aviation, butthis may not always be the case. The ability to track <strong>and</strong> forecast the movement <strong>of</strong><strong>hazardous</strong> <strong>clouds</strong> using satellite-based SO 2 measurements is <strong>of</strong> great value <strong>and</strong> as indicatedearlier, global alert systems have been developed to provide aviation warnings using thesedata.5 The global threat to aviation from <strong>volcanic</strong> eruption <strong>clouds</strong>Volcanic <strong>clouds</strong> move with the prevailing winds at the height <strong>of</strong> injection. At the onset <strong>of</strong>an eruption, it is likely that ash <strong>and</strong> gases are spread throughout the vertical column up tothe maximum height reached by the cloud, which depends on the energetics <strong>of</strong> the eruptionwith some dependency on environmental conditions. During the first few hours <strong>of</strong> eruption,the vicinity in the neighbourhood <strong>of</strong> the volcano poses the greatest threat to aviation.Usually precursor information about the activity <strong>of</strong> the volcano is available <strong>and</strong> aviation isalerted well before an eruption occurs. Following a significant eruption, the ash <strong>and</strong> gasescan be transported over great distances, but are usually confined to a much smaller verticalrange <strong>of</strong> 1–2 km. Dispersion modelling <strong>of</strong> the movement <strong>of</strong> the cloud then dependscritically on knowledge <strong>of</strong> the location <strong>of</strong> the cloud in the vertical, <strong>and</strong> less on the windfields, as these are generally known more accurately. Current practice is to guess the height<strong>of</strong> the cloud based upon trial-<strong>and</strong>-error fits between observations <strong>of</strong> the <strong>clouds</strong> <strong>and</strong> modelruns. VAACs use this information cautiously, together with other sources <strong>of</strong> information.They will advise that airspace is affected from the ground up to the suspected maximumheight <strong>of</strong> the <strong>volcanic</strong> cloud, <strong>and</strong> express this in aviation terminology using flight levels,e.g. FL 350 means a pressure altitude <strong>of</strong> 35,000 ft or 10,700 m. Air traffic should thendivert around a rather large spatial region which covers the horizontal location <strong>of</strong> the cloud<strong>and</strong> the vertical region from the ground up to FL X, where X is the designated flightlevel affected. While this strategy is risk averse, it can be a financial burden <strong>and</strong> perhapsunnecessary for the operator. This is because the <strong>volcanic</strong> cloud will, in most cases, beconfined in the vertical to a layer <strong>of</strong> 1–2 km thickness <strong>and</strong> may not contain ash. The residencetime <strong>of</strong> fine ash in the upper troposphere is <strong>of</strong> the order <strong>of</strong> several hours to a fewdays, <strong>and</strong> in a dispersed state the ash may not be a hazard to aircraft, although some casestudies seem to indicate even undetected, very low concentration ash <strong>clouds</strong> may still posea threat (Pieri et al. 2002; Tupper et al. 2004). Given the range <strong>of</strong> uncertainties present inpredicting <strong>volcanic</strong> eruption activity, in knowledge <strong>of</strong> the injection height pr<strong>of</strong>ile <strong>of</strong> aneruption <strong>and</strong> in establishing the minimum ash concentration level that is still dangerous toaviation, only fairly general indications <strong>of</strong> vulnerability can be established.The mid- <strong>and</strong> upper-troposphere (MUT) wind circulation patterns are fundamental toestablishing the hazard posed to commercial inter-continental aviation from dispersing<strong>volcanic</strong> <strong>clouds</strong>. In the MUT, zonal winds are stronger than meridional winds <strong>and</strong> consequently<strong>volcanic</strong> <strong>clouds</strong> tend to travel rapidly in the zonal direction. The long-term meanzonal wind fields at 250 hPa (10 km) are shown in Fig. 4 for the months <strong>of</strong> January(Fig. 4a) <strong>and</strong> July (Fig. 4b). Most notable in these plots are the strong zonal jets at roughly30° N in January <strong>and</strong> 30° S in July. Zonal winds are generally quite weak ±10° latitudeeither side <strong>of</strong> the equator, but there is a noticeable seasonal dependence, with easterlies123
Nat HazardsFig. 4 Long-term mean zonal winds in m s -1 for (a) January <strong>and</strong> (b) July (Reproduced from NOAA/ESRLPhysical Sciences Division, see: http://www.cdc.noaa.gov/cgi-bin/PublicData/getpage.pl)123
Nat Hazardsdominating at latitudes north <strong>of</strong> the equator in July. Similar plots <strong>of</strong> the mean meridionalwind component for January <strong>and</strong> July are shown in Fig. 5a, b. Meridional winds in Januarytend to be more northerly <strong>and</strong> can reach 6 m s -1 in the high latitudes <strong>of</strong> the winterhemisphere. Equatorial winds are weak at both times <strong>of</strong> the year. Some general commentscan be made about the likely spread <strong>of</strong> <strong>volcanic</strong> <strong>clouds</strong> that reach 10 km altitude based onthese mean wind circulation patterns. For eruptions that occur near equatorial latitudes inJuly, the dispersion will most likely be westwards with little transport polewards. In factthis was observed for the eruption <strong>of</strong> Pinatubo for <strong>clouds</strong> that reached much higher altitudes,since the wind structure at 10 km is similar up to 30 km or so (see Fig. 6). Eruptionsthat occur at higher latitudes will spread <strong>volcanic</strong> debris in directions <strong>and</strong> at speeds thatdepend on the hemisphere <strong>and</strong> the season. In July, Chilean eruption <strong>clouds</strong> will travelrapidly eastwards <strong>and</strong> southwards <strong>and</strong> it is very unlikely the <strong>clouds</strong> will spread to thenorthern hemisphere <strong>and</strong> more likely they will be confined to circumnavigate the southernhemisphere at latitudes south <strong>of</strong> 30° S. This was observed for the August, 1991 eruption <strong>of</strong>Mt Hudson, which spread <strong>volcanic</strong> <strong>clouds</strong> eastwards towards Australia causing some minoraviation incidents (Barton et al. 1992). Eruptions occurring in Japan <strong>and</strong> northwards alongthe Kamchatkan peninsula will spread <strong>clouds</strong> eastwards <strong>and</strong> at greater speeds in Januarythan in July. The meridional winds will take these <strong>clouds</strong> southwards in summer (July) <strong>and</strong>northwards in winter (January). The north-eastward spreading <strong>of</strong> <strong>volcanic</strong> <strong>clouds</strong> emanatingfrom Japanese or Kamchatkan volcanoes in winter is likely to create greater risk foraviation using the busy north Pacific air routes that connect Japan to the USA.The main air corridor connecting air traffic between USA <strong>and</strong> continental Europe liesbetween latitudes 45–65° N <strong>and</strong> crosses the north Atlantic—the so-called North AtlanticTracks (NATs). Volcanic eruptions from Icel<strong>and</strong> could potentially disrupt air traffic usingthe NATs. Greatest impact would occur when meridional winds are northerly <strong>and</strong> zonalwinds weak. This would bring <strong>clouds</strong> southwards directly intersecting the NATs. A wintertimeeruption fits this scenario better than a summertime event. At lower altitudes (\5 km)the meridional winds in January tend to be southerly, keeping lower altitude eruption<strong>clouds</strong> away from Europe <strong>and</strong> the main air routes. A more typical trajectory for <strong>volcanic</strong><strong>clouds</strong> originating from Icel<strong>and</strong> is transport eastwards with northward confinement <strong>and</strong>circumnavigation <strong>of</strong> the pole. While this trajectory has been documented (Carn et al.2008), it is a much less serious threat to aviation, due to the low density <strong>of</strong> air traffic atthese high latitudes. Another possible trajectory for Icel<strong>and</strong>ic eruption <strong>clouds</strong> consists <strong>of</strong>rapid eastward <strong>and</strong> then southward transport which brings the <strong>clouds</strong> over eastern Europe<strong>and</strong> into the busy continental air routes. This trajectory has also been documented from aneruption <strong>of</strong> Grimsvotn in 2004 (Witham et al. 2007), which caused some grounding <strong>of</strong>European aviation but no serious incidents were reported.Over the busy (especially for air freight) trans-Pacific air routes between Japan <strong>and</strong> Asia<strong>and</strong> continental USA, the main threat is from Japanese volcanoes, volcanoes in Kamchatka<strong>and</strong> volcanoes along the Aleutian chain <strong>and</strong> into south-western Alaska. The whole region is<strong>volcanic</strong>ally active <strong>and</strong> there have been several aviation related incidents with ash <strong>clouds</strong>generated by volcanoes in this region. At most times <strong>of</strong> the year the zonal winds traveleastwards, taking <strong>volcanic</strong> debris from Japan/Kamchatka towards continental USA <strong>and</strong>into higher density air traffic. Two well-documented cases <strong>of</strong> aviation incidents haveoccurred in this region, both during the winter season. In the case <strong>of</strong> the KLM 747commercial jet on route to Anchorage, Alaska from Amsterdam, Netherl<strong>and</strong>s the encounteroccurred in December 1989 <strong>and</strong> close to the Mt Redoubt volcano (60.485° N, 152.742° W)(Casadevall 1994). The aircraft was travelling south-eastwards towards the ash plume,which was moving north-westwards, with the mean winter winds (see Figs. 4a <strong>and</strong> 5a).123
Nat HazardsFig. 5 Long-term mean meridional winds in m s -1 for (a) January <strong>and</strong> (b) July (Reproduced from NOAA/ESRL Physical Sciences Division, see: http://www.cdc.noaa.gov/cgi-bin/PublicData/getpage.pl)123
Nat HazardsFig. 6 Latitude-height cross-sections <strong>of</strong> the mean zonal winds for (a) January <strong>and</strong> (b) July (After Fleminget al. 1988)A dispersion model (PUFF) animation <strong>of</strong> this encounter can be found at: http://puff.images.alaska.edu/Redoubt_webpage/Puff_redoubt_ash.shtml. A more recent event in thisregion occurred in February 2000 when Clevel<strong>and</strong> volcano (52.82° N, 167.95° W) erupted<strong>and</strong> sent an extensive plume <strong>of</strong> ash towards the north-northeast, in agreement withexpectation based on the mean wind circulation—for animation <strong>of</strong> this event see:http://puff.images.alaska.edu/animations/Cleve_021901_76.gif. Some ash also moved in asouth–southeast direction <strong>and</strong> intersected air traffic <strong>of</strong>f the west coast <strong>of</strong> the USA. Fouraviation encounters were reported in the vicinity <strong>of</strong> the volcano, <strong>and</strong> one encounter wasreported <strong>of</strong>f California at FL-300 with a B-747 (Simpson et al. 2002).Aviation traffic is increasing <strong>and</strong> is expected to grow at a rate <strong>of</strong> between 2.2% to 4.7%per year for the period 1990–2050 (ESCAP 2005). There are significant regional differencesin the current growth rate <strong>of</strong> commercial aviation traffic <strong>and</strong> also in the projected123
Nat Hazardsrates. Largest increases are expected in the Middle East <strong>and</strong> Asia Pacific regions, withmany more commercial <strong>and</strong> freight traffic crossing the Pacific Rim. During 2004–2007commercial air traffic grew at 8.6% for the Asia/Pacific region, compared to 6.8% for theworld. The Middle East region grew at an annual average rate <strong>of</strong> 10.9%. Air freight trafficis also growing. For the period 2002–2015 air freight traffic is expected to grow at anannual average rate <strong>of</strong> 6.4% for the Asia Pacific, 6.6% for the Middle East <strong>and</strong> 5.5%globally (ESCAP 2005). The Asia Pacific region is also a region with many volcanoes—approximately 450, <strong>and</strong> about 50% <strong>of</strong> the world’s active volcanoes lie along the PacificRim—the so-called ‘‘Ring <strong>of</strong> Fire’’. Coupled with the trend from using 4-engined jetaircraft to using twin-engined aircraft, there is a significant increase in vulnerability <strong>of</strong> theworld’s air traffic fleet to loss <strong>of</strong> aircraft due to encounters with a <strong>volcanic</strong> ash cloud.Figure 7 shows an estimate <strong>of</strong> the global air traffic density based on the 2002 NOxemissions taken from the AERO2k emissions inventory (Eyres et al. 2004) for the month<strong>of</strong> October <strong>and</strong> for flight levels <strong>of</strong> FL 350 (pressure altitude <strong>of</strong> 33,000 ft) to FL 390(39,000 ft). NOx emissions are used here as a proxy for air traffic density <strong>and</strong> are a goodindicator <strong>of</strong> the global spatial pattern <strong>of</strong> air traffic. Also shown on this Figure are allFig. 7 Global density <strong>of</strong> air traffic as measured by monthly averaged NOx emissions for FL 350 to FL 390(pressure altitudes <strong>of</strong> 33,000 ft up to 39,000 ft) taken from the AERO2k emissions inventory <strong>of</strong> Eyers et al.(2004). Emissions are shown for October 2002. The colour code is linearly scaled with greatest emissionsrepresented as deepest blue. The red triangles indicate the positions <strong>of</strong> Holocene <strong>and</strong> Historically listedvolcanoes taken from the Smithsonian database (Simkin <strong>and</strong> Siebert 1994). There are over 1,200 volcanoesindicated on the plot. The OMI SO 2 column observations from the eruption <strong>of</strong> Jebel at Tair during 1–10October 2007 are also shown on this plot. These data are scaled to show the relative column amounts eachday as observed by OMI, with red representing the highest values <strong>and</strong> green the lowest123
Nat HazardsHolocene <strong>and</strong> historically known volcanoes (Simkin <strong>and</strong> Seibert 1994). The greatest trafficdensities are seen over Europe <strong>and</strong> North America, with noticeable air traffic trajectoriesacross the north Atlantic (the NATs) <strong>and</strong> from Japan to south-east Asian populationcentres. To illustrate the vulnerability <strong>of</strong> air traffic to encounters with <strong>volcanic</strong> <strong>clouds</strong>, theOMI SO 2 cloud observations from the eruption <strong>of</strong> Jebel at Tair during 1–10 October, 2007are overlaid onto the Figure. Eckhardt et al. (2008) estimate that the cloud travelled mostlyjust above the tropopause at altitudes between 14 <strong>and</strong> 16 km. As most commercial aircraftcruise at around 13 km (39,000 ft) this may not have been a problem for currently operatingair traffic, however should fleets <strong>of</strong> HSCT aircraft operate in the future, dispersed<strong>volcanic</strong> debris, far from its source will become an increasing risk to these aircraft. Latermodelled trajectories suggest that the cloud may have re-entered the troposphere <strong>and</strong>re-curved south <strong>and</strong> westwards towards India, where OMI also observed the cloud, albeit atmuch lower concentrations.With increased air traffic over the Asia/Pacific region <strong>and</strong> with many active volcanoeslocated there, it is concluded that this region will become increasingly vulnerable toaviation/<strong>volcanic</strong> cloud encounters. The potential for an encounter is illustrated using theair traffic density forecast for 2025 <strong>and</strong> an eruption from a remote volcano located in theNorthern Mariana Isl<strong>and</strong>s. During 2003 until the present, Anatahan volcano in the NorthernMariana Isl<strong>and</strong>s (16.35° N, 145.67° E) has been emitting ash <strong>clouds</strong> into the atmosphere atregular intervals. This volcano lies under an air route from Guam <strong>and</strong> Saipan to Japan <strong>and</strong>ash <strong>clouds</strong> from the volcano frequently intercept the major air routes from south-eastAustralia, <strong>and</strong> the Philippines to Japan <strong>and</strong> Korea. Figure 8 shows the coincidence <strong>of</strong>forecast April 2025 air traffic density (FL 350 to FL 390) with volcanoes <strong>and</strong> an AIRS SO 2cloud from Anatahan for April 2005. This cloud covered an area <strong>of</strong> more than 1.3 millionkm 2 over 3 days in April, reached an altitude <strong>of</strong> at least 15 km (*48,000 ft) <strong>and</strong> airtraffic was diverted on several occasions. The ash <strong>and</strong> gas cloud continued to spreadwestwards, eventually intercepting Philippine air space <strong>and</strong> continued on towards theSouth China Sea. At most times <strong>of</strong> the year, eruptions in this region are likely to send ashwestwards <strong>and</strong> into busy air corridors involving south-east Asia, Japan, Korea <strong>and</strong>Australia.6 Conclusions<strong>Satellite</strong> instruments are able to identify <strong>and</strong> track <strong>hazardous</strong> ash <strong>and</strong> SO 2 <strong>clouds</strong> in theatmosphere for hours to several weeks. Ash has a considerably shorter lifetime (*hours) inthe atmosphere than SO 2 (*days to weeks) <strong>and</strong> is more difficult to identify <strong>and</strong> quantify.Ash is much more <strong>hazardous</strong> to jet aircraft than SO 2 <strong>and</strong> has been responsible for severalcomplete engine shut-downs <strong>and</strong> significant air-frame damage. Under favourable circumstancesit appears that by tracking SO 2 <strong>clouds</strong> from satellite, the movement <strong>of</strong> the more<strong>hazardous</strong> ash <strong>clouds</strong> may be inferred, but care must be taken as there are documentedcases (Schneider et al. 1999; Prata <strong>and</strong> Kerkmann 2007) where ash <strong>and</strong> SO 2 separate <strong>and</strong>travel in different directions <strong>and</strong> at different heights in the atmosphere. Operationally thereare no reliable ash cloud height estimates available from satellites. The CALIPSO lidar canprovide excellent height estimates for aerosols (H 2 SO 4 aerosol in the case <strong>of</strong> <strong>volcanic</strong><strong>clouds</strong>), but the poor horizontal spatial coverage <strong>and</strong> poor temporal coverage make theinstrument inadequate for operational use. The recent study by Eckhardt et al. (2008) hasshown that by using satellite estimates <strong>of</strong> <strong>volcanic</strong> cloud trajectories with Lagrangi<strong>and</strong>ispersion models, the injection height pr<strong>of</strong>ile <strong>of</strong> the <strong>volcanic</strong> eruption may be estimated.123
Nat HazardsFig. 8 Asia Pacific regional air traffic density from monthly averaged forecast NOx emissions for FL 350 toFL 390 (pressure altitudes <strong>of</strong> 33,000 ft up to 39,000 ft) taken from the AERO2k emissions inventory <strong>of</strong>Eyres et al. (2004). Forecast emissions are shown for April 2025. The colour code is linearly scaled withgreatest emissions represented as deepest blue. The red triangles indicate the positions <strong>of</strong> Holocene <strong>and</strong>Historically listed volcanoes taken from the Smithsonian database (Simkin <strong>and</strong> Siebert 1994). There are over450 volcanoes indicated on the plot. The AIRS SO 2 column observations from the eruption <strong>of</strong> Anatah<strong>and</strong>uring 6–8 April 2005 are also shown on this plot. These data are scaled to show the relative columnamounts each day as observed by AIRS, with red representing the highest values <strong>and</strong> lilac, the lowestThis much more objective estimate <strong>of</strong> the cloud height can then be used to forecast thecloud movement with greater confidence <strong>and</strong> accuracy. For some regions, where 15-mininfrared data are available from geosynchronous satellites, it will be possible to reliablytransmit accurate 3D trajectories <strong>of</strong> <strong>hazardous</strong> <strong>volcanic</strong> <strong>clouds</strong> for use by the aviationindustry. By supplying height <strong>and</strong> horizontal spatial information on the location <strong>and</strong>movement <strong>of</strong> <strong>volcanic</strong> <strong>clouds</strong>, the aviation industry will be able to re-route air traffic asnecessary <strong>and</strong> at the same time minimize the extra fuel used. <strong>Satellite</strong> data can also be usedto identify <strong>volcanic</strong> <strong>clouds</strong> that are predominantly composed <strong>of</strong> SO 2 <strong>and</strong>/or <strong>volcanic</strong> ash.This information may be used by the aviation industry to determine the appropriate postmaintenanceprocedures required in the event <strong>of</strong> an encounter with a <strong>volcanic</strong> cloud. Asash is known to cause engine damage <strong>and</strong> clogging <strong>of</strong> pitot static tubes <strong>and</strong> SO 2 is notimplicated in this kind <strong>of</strong> damage, there may be an economic advantage in utilizing thisinformation.It has been noted that commercial <strong>and</strong> freight air traffic is growing globally <strong>and</strong>regionally, with the Asia Pacific region experiencing one <strong>of</strong> the highest annual growthrates. The region also contains many volcanoes <strong>and</strong> is thus vulnerable to air traffic <strong>volcanic</strong>123
Nat Hazardscloud encounters. The introduction <strong>of</strong> fleets <strong>of</strong> HSCT travelling at speeds <strong>of</strong> up to mach 2.5<strong>and</strong> cruising at altitudes as high as 20 km will increase the aviation/<strong>volcanic</strong> cloudencounter risk. The much higher aircraft speeds will also dem<strong>and</strong> much shorter warningtimes, suggesting a need for either a constellation <strong>of</strong> polar-orbiting instruments or anetwork (5–6) <strong>of</strong> geosynchronous rapid scan instruments. Vulnerability maps can bedeveloped based on proxies for air traffic densities, which provide a good indication <strong>of</strong> theair traffic spatial habit. Atmospheric dispersion models are now capable <strong>of</strong> providingreliable forecasts <strong>of</strong> <strong>volcanic</strong> cloud movement for several days from the onset <strong>of</strong> eruption,provided good injection height information is available. The air traffic density maps,dispersion model runs, volcano locations <strong>and</strong> wind analyses provide the ingredients todevelop scenarios for aviation/<strong>volcanic</strong> cloud encounters. These scenario generators can beused for examining risks <strong>and</strong> vulnerabilities <strong>and</strong> for examining potential problems shouldHSCT aircraft become operational.AppendixTable 4 List <strong>of</strong> acronymsASTERAIRSATSRAVHRRCALIPSOGOESGOMEHIRSHYSPLITIASIIRMetOPMLSMODISMSGMUTNOAAOMIPUFFSCIAMACHYSEVIRITIROSTOMSUVVISSRAdvanced Spaceborne Thermal Emission <strong>and</strong> Reflection RadiometerAtmospheric InfraRed SpectrometerAlong-Track Scanning RadiometerAdvanced Very High Resolution RadiometerCloud-Aerosol Lidar <strong>and</strong> Infrared Pathfinder <strong>Satellite</strong> ObservationsGeosynchronous Orbiting Environmental <strong>Satellite</strong>Global Ozone Monitoring ExperimentHigh resolution InfraRed SounderHYbrid Single-Particle Lagrangian Integrated TrajectoryInfrared Atmospheric Sounding InterferometerInfraRedOperational meteorological satelliteMicrowave Limb SounderModerate Resolution Imaging SpectroradiometerMeteosat Second GenerationMid- <strong>and</strong> Upper-TroposphereNational Oceanographic <strong>and</strong> Atmospheric AdministrationOzone Monitoring InstrumentVolcanic Ash Tracking ModelSCanning Imaging Absorption SpectroMeter for Atmospheric CartographySpinning Enhanced Visible <strong>and</strong> InfraRed ImagerTelevision <strong>and</strong> Infrared Orbiting <strong>Satellite</strong>Total Ozone Mapping SpectrometerUltra-VioletVisible <strong>and</strong> Infrared Spin Stabilized Radiometer123
Nat HazardsReferencesBarton IJ, Prata AJ, Watterson IG, Young SA (1992) Identification <strong>of</strong> the Mount Hudson <strong>volcanic</strong> cloudover SE Australia. Geophys Res Lett 19:1211–1214Bernard A, Rose WI (1984) The injection <strong>of</strong> sulfuric acid aerosols in the stratosphere by the El Chichonvolcano <strong>and</strong> its related hazards to the international air traffic. Nat Hazards 3(1):59–67. doi:10.1007/BF00144974Bluth GJS, Schnetzler CC, Krueger AJ, Walter LS (1993) The contribution <strong>of</strong> explosive volcanism to globalatmospheric sulphur dioxide concentrations. Nature 366:327–329Carn SA, Krueger AJ, Krotkov NA, Gray MA (2004) Fire at Iraqi sulfur plant emits SO 2 <strong>clouds</strong> detected byEarth Probe TOMS. Geophys Res Lett 31:L19105. doi:10.1029/2004GL020719Carn SA, Krotkov NA, Yang K, H<strong>of</strong>f RM, Prata AJ, Krueger AJ, Loughlin SC, Levelt PF (2007) Extendedobservations <strong>of</strong> <strong>volcanic</strong> SO 2 <strong>and</strong> sulphate aerosol in the stratosphere. Atmos Chem Phys Discuss7:2857–2871Carn SA, Prata AJ, Karlsdottir S (2008) Circumpolar transport <strong>of</strong> a <strong>volcanic</strong> cloud from Hekla (Icel<strong>and</strong>).J Geophys Res 113. doi:10.1029/2008JD009878Casadevall TJ (1994) The 1989/1990 eruption <strong>of</strong> Redoubt Volcano Alaska: impacts on aircraft operations.J Volcanol Geotherm Res 62(30):301–316Casadevall TJ, Delos Reyes PJ, Schneider DJ (1996) The 1991 Pinatubo eruptions <strong>and</strong> their effects onaircraft operations. In: Newhall CG, Punongbayan RS (eds) Fire <strong>and</strong> mud: eruptions <strong>and</strong> lahars <strong>of</strong>Mount Pinatubo, Philippines. Philippines Institute <strong>of</strong> Volcanology <strong>and</strong> Seismology, Quezon City,University <strong>of</strong> Washington Press, Seattle, pp 625–636Chahine MT, Pagano TS, Aumann HH, Atlas R, Barnet C, Blaisdell J, Chen L, Divakarla M, Fetzer EJ,Goldberg M, Gautier C, Granger S, Hannon S, Irion FW, Kakar R, Kalnay E, Lambrigtsen BH, Lee S-Y,LeMarshall J, McMillan WW, McMillin L, Olsen ET, Revercomb H, Rosenkranz P, Smith WL, Staelin D,Strow LL, Susskind J, Tobin D, Wolf W, Zhou L (2006) AIRS: improving weather forecasting <strong>and</strong>providing new data on greenhouse gases. Bull Am Meteorol Soc 87:910–926. doi:10.1175/BAMS-87-7-911Clerbaux C, Hadji-Lazaro J, Turquety S, George M, Coheur P-F, Hurtmans D, Wespes C, Herbin H,Blumstein D, Tournier B, Phulpin T (2007) The IASI/MetOp I mission: first observations <strong>and</strong> highlights<strong>of</strong> its potential contribution to GMES. COSPAR Inf Bull 2007:19–24Constantine EK, Bluth GJS, Rose WI (2000) TOMS <strong>and</strong> AVHRR sensors applied to drifting <strong>volcanic</strong> <strong>clouds</strong>from the august 1991 eruptions <strong>of</strong> Cerro Hudson. In: Mouginis-Mark P, Crisp J, Fink J (eds) AGUMonograph 116—Remote Sensing <strong>of</strong> Active Volcanism, pp 45–64Eckhardt S, Prata AJ, Seibert P, Steibel K, Stohl A (2008) Estimation <strong>of</strong> the vertical pr<strong>of</strong>ile <strong>of</strong> sulfur dioxideinjection into the atmosphere by a <strong>volcanic</strong> eruption using satellite column measurements <strong>and</strong> inversetransport modeling. Atmos Chem Phys Discuss 8:3761–3805Eisinger M, Burrows JP (1998) Tropospheric sulfur dioxide observed by the ERS-2 GOME instrument.Geophys Res Lett 25(22):4177–4180Ellrod GP, Connell BH, Hillger DW (2003) Improved <strong>detection</strong> <strong>of</strong> airborne <strong>volcanic</strong> ash using multispectralinfrared satellite data. J Geophys Res 108(D12):4356. doi:10.1029/2002JD002802ESCAP (2005) Review <strong>of</strong> developments in transport in Asia <strong>and</strong> the Pacific 2005, United Nations Publ., No.E.06.II.F.9, ST/ESCAP/2392, 172 ppEyers CJ, Norman P, Middel J, Michot S, Atkinson K, Christou RA (2004) AERO2k global aviationemissions inventories for 2002 <strong>and</strong> 2025. European Commission Contract, No. G4RD-CT-2000-00382,QINETIQ/04/0113, 144 ppFleming EL, Ch<strong>and</strong>ra S, Shoeberl MR, Barnett JJ (1988) Monthly mean global climatology <strong>of</strong> temperature,wind, geopotential height <strong>and</strong> pressure for 0–120 km. National Aeronautics <strong>and</strong> Space Administration,Technical Memor<strong>and</strong>um 100697, Washington, DCGuffanti M, Albersheim S (2008) The United States national <strong>volcanic</strong> ash operations plan for aviation. NatHazards Special Issue: Aviation hazards from volcanoes. doi:10.1007/s11069-008-9247-1Hanstrum BN, Watson AS (1983) A case study <strong>of</strong> two eruptions <strong>of</strong> Mount Galunggung <strong>and</strong> an investigation<strong>of</strong> <strong>volcanic</strong> eruption cloud characteristics using remote sensing techniques. Aust Meteorol Mag31:131–177Hillger DW, Clark JD (2002a) Principal component image analysis <strong>of</strong> MODIS for <strong>volcanic</strong> ash. Part I: mostimportant b<strong>and</strong>s <strong>and</strong> implications for future GOES imagers. J Appl Meteorol 41:985–1001Hillger DW, Clark JD (2002b) Principal component image analysis <strong>of</strong> MODIS for <strong>volcanic</strong> ash. Part II:simulation <strong>of</strong> current GOES <strong>and</strong> GOES-M imagers. J Appl Meteorol 41:1003–1010Holasek RE, Rose WI (1991) Anatomy <strong>of</strong> 1986 Augustine volcano eruptions as recorded by multispectralimages processing <strong>of</strong> digital AVHRR weather satellite data. Bull Volcanol 53:42–435123
Nat HazardsHolasek RE, Woods AW, Self S (1996) Experiments on gas-ash separation processes in <strong>volcanic</strong> umbrella<strong>clouds</strong>. J Volcanol Geotherm Res 70:169–181Krotkov NA, Carn SA, Krueger AJ, Bhartia PK, Yang K (2006) B<strong>and</strong> residual difference algorithm forretrieval <strong>of</strong> SO 2 from the Aura Ozone Monitoring Instrument (OMI). IEEE Trans Geosci Remote Sens44(5):1259–1266Krueger AJ (1983) Sighting <strong>of</strong> El Chichon sulfur dioxide <strong>clouds</strong> with the nimbus 7 total ozone mappingspectrometer. Science 220:1377–1379Krueger AJ, Walter LS, Bhartia PK, Schnetzler CC, Krotkov NA, Sprod I, Bluth GJS (1995) Volcanic sulfurdioxide measurements from the total ozone mapping spectrometer instruments. J Geophys Res100(D7):14057–14076Krueger AJ, Schaefer SJ, Krotkov N, Bluth GJS, Baker S (2000) Ultraviolet remote sensing <strong>of</strong> <strong>volcanic</strong>emissions. In: Mouginis-Marks PJ, Crisp JA, Fink JH (eds) Remote sensing <strong>of</strong> active volcanism.Geophys Monogr Ser 116:2543, AGU, Washington, DCMalingreau J, Kasw<strong>and</strong>a P (1986) Monitoring <strong>volcanic</strong> eruptions in Indonesia using weather satellite data:the Colo eruption <strong>of</strong> July 28, 1983. J Volcanol Geotherm Res 27(1–2):179–194Matson M (1984) The 1982 El Chichon volcano eruptions—a satellite perspective. J Volcanol GeothermRes 23:1–10Miller TP, Casadevall TJ (1999) Volcanic ash hazards to aviation. In: Sigurdsson H, Houghton B, McNuttSR, Ryman H, Stix J (eds) Encyclopedia <strong>of</strong> volcanoes. Academic Press, San Diego, pp 915–930Mosher FR (2000) Four channel <strong>volcanic</strong> ash <strong>detection</strong> algorithm, Preprint Volume. 10th Conference on<strong>Satellite</strong> Meteorology <strong>and</strong> Oceanography, Long Beach, California, 9–14 January, 2000, pp 457–460Pavolonis MJ, Feltz WF, Heidinger AK, Gallina GM (2006) A daytime complement to the reverseabsorption technique for improved automated <strong>detection</strong> <strong>of</strong> <strong>volcanic</strong> ash. J Atmos Oceanic Technol23:1422–1444Pergola N, Tramutoli V, Marchese F, Scaffidi I, Lacav T (2004) Improving <strong>volcanic</strong> ash cloud <strong>detection</strong> by arobust satellite technique. Remote Sens Environ 90:1–22Pieri D, Ma C, Simpson JJ, Hufford G, Grindle T, Grove C (2002) Analyses <strong>of</strong> in-situ airborne ash from theFebruary 2000 eruption <strong>of</strong> Hekla volcano, Icel<strong>and</strong>. Geophys Res Lett 29:16. doi:10.1029/2001GL013688Prata AJ (1989a) Observations <strong>of</strong> <strong>volcanic</strong> ash <strong>clouds</strong> using AVHRR-2 radiances. Int J Remote Sens10(4–5):751–761Prata AJ (1989b) Radiative transfer calculations for <strong>volcanic</strong> ash <strong>clouds</strong>. Geophys Res Lett 16(11):1293–1296Prata AJ, Grant IF (2001) Retrieval <strong>of</strong> microphysical <strong>and</strong> morphological properties <strong>of</strong> <strong>volcanic</strong> ash plumesfrom satellite data: application to Mt. Ruapehu, New Zeal<strong>and</strong>. Q J R Meteorol Soc 127(576B):2153–2179Prata AJ, Kerkmann J (2007) Simultaneous retrieval <strong>of</strong> <strong>volcanic</strong> ash <strong>and</strong> SO 2 using MSG-SEVIRI measurements.Geophys Res Lett 34:L05813. doi:10.1029/2006GL028691Prata AJ, Bluth GJS, Rose WI, Schneider DJ, Tupper AC (2001) Comments on Failures in detecting<strong>volcanic</strong> ash from a satellite-based technique. Remote Sens Environ 78:341–346Prata AJ, Rose WI, Self S, O’Brien DM (2003) Global, long-term sulphur dioxide measurements fromTOVS data: a new tool for studying explosive volcanism <strong>and</strong> climate. Volcanism <strong>and</strong> the Earth’satmosphere, geophysics monograph 139 AGU, pp 75–92Prata AJ, Carn SA, Stohl A, Kerkmann J (2007) Long range transport <strong>and</strong> fate <strong>of</strong> a stratospheric <strong>volcanic</strong>cloud from Soufriere ills volcano, Montserrat. Atmos Chem Phys 7:5093–5103Richardson AJ (1984) El Chichon <strong>volcanic</strong> ash effects on atmospheric haze measured by NOAA-7 AVHRRdata. Remote Sens Environ 16:157–164Richter A, Wittrock F, Burrows JP (2006) SO 2 measurements with SCIAMACHY. In: Proceedings <strong>of</strong> thefirst conference on atmospheric science, Frascati, Italy, 8–12 May 2006. ESA publication SP-628Rose WI, Delene DJ, Schneider DJ, Bluth GJS, Kruger AJ, Sprod I, McKee C, Davies HL, Ernst GJ (1995)Ice in the 1994 Rabaul eruption: implications for <strong>volcanic</strong> hazard <strong>and</strong> atmospheric effects. Nature375:477–479Sawada Y (1987) Study on analysis <strong>of</strong> <strong>volcanic</strong> eruptions based on eruption cloud image data obtained bythe Geostationary Meteorological <strong>Satellite</strong> (GMS). Technical reports <strong>of</strong> the Meteorological ResearchInstitute, vol 22, 335 ppSawada Y (1996) Detection <strong>of</strong> explosive eruptions <strong>and</strong> regional tracking <strong>of</strong> <strong>volcanic</strong> ash <strong>clouds</strong> withgeostationary meteorological satellites (GMS). In: Scarpa R, Tilling RI (eds) Monitoring <strong>and</strong> mitigation<strong>of</strong> volcano hazards. Springer-Verlag, Berlin, Heidelberg, pp 299–314Schneider DJ, Rose WI, Kelley L (1995) Tracking <strong>of</strong> 1992 eruption <strong>clouds</strong> from Crater Peak <strong>of</strong> Mount Spurrvolcano, Alaska, using AVHRR. US Geol Surv Bull 2139:27–36123
Nat HazardsSchneider DJ, Rose WI, Coke LR, Bluth GJS (1999) Early evolution <strong>of</strong> a stratospheric <strong>volcanic</strong> eruptioncloud as observed with TOMS <strong>and</strong> AVHRR. J Geophys Res 104(D4):4037–4050Simkin T, Seibert L (1994) Volcanoes <strong>of</strong> the world, 2nd edn. Geoscience Press, TucsonSimpson JJ, Hufford G, Pieri D, Berg J (2000) Failures in detecting <strong>volcanic</strong> ash from a satellite-basedtechnique. Remote Sens Environ 72:191–217Simpson JJ, Hufford G, Pieri D, Servranckx R, Berg J (2002) The february 2001 eruption <strong>of</strong> MountClevel<strong>and</strong>, Alaska: case study <strong>of</strong> an aviation hazard. Weather Forecast 17:691–704Thomas W, Erbertseder T, Ruppert T, Van Roozendael M, Verdebout J, Balis D, Meleti C, Zerefos C (2004)On the retrieval <strong>of</strong> <strong>volcanic</strong> sulfur dioxide emissions from GOME backscatter measurements. J AtmosChem 50:295–320. doi:10.1007/s10874-005-5079-5Torres O, Bhartia PK, Herman JR, Ahmad Z, Gleason J (1998) Derivation <strong>of</strong> aerosol properties fromsatellite measurements <strong>of</strong> backscattered ultraviolet radiation: theoretical basis. J Geophys Res103(D14):17099–17110Tupper A, Carn SA, Davey J, Kamada Y, Potts RJ, Prata AJ, Tokuno M (2004) An evaluation <strong>of</strong> <strong>volcanic</strong>cloud <strong>detection</strong> techniques during recent significant eruptions in the western ring <strong>of</strong> fire. Remote SensEnviron 91:27–46Urai M (2004) Sulfur dioxide flux estimation from volcanoes using advanced spaceborne thermal emission<strong>and</strong> reflection radiometer—a case study <strong>of</strong> Miyakejima volcano, Japan. J Volcanol Geotherm Res134(1–2):1–13Van Geffen J, Van Roozendael M, Di Nicolantonio W, Tampellini L, Valks P, Erbetseder T, Van der AR(2007) Monitoring <strong>of</strong> <strong>volcanic</strong> activity from satellite as part <strong>of</strong> GSE PROMOTE. Proceedings <strong>of</strong> thefirst conference on atmospheric science, Frascati, Italy, 8–12 May 2006. ESA publication SP-628Watkin SC (2003) The application <strong>of</strong> AVHRR data for the <strong>detection</strong> <strong>of</strong> <strong>volcanic</strong> ash in a <strong>volcanic</strong> ashadvisory centre. Meteorol Appl 10:301–311Wei C-F, Larson SM, Pattena KO, Wuebbles DJ (2001) Modeling <strong>of</strong> ozone reactions on aircraft-related sootin the upper troposphere <strong>and</strong> lower stratosphere. Atmos Environ 35:6167–6180Wen S, Rose WI (1994) Retrieval <strong>of</strong> sizes <strong>and</strong> total masses <strong>of</strong> particles in <strong>volcanic</strong> <strong>clouds</strong> using AVHRRb<strong>and</strong>s 4 <strong>and</strong> 5. J Geophys Res 99(D3):5421–5431Witham CS, Hort MC, Potts R, Servranckx R, Husson P, Bonnardot F (2007) Comparison <strong>of</strong> VAACatmospheric dispersion models using the 1 November 2004 Grimsvtn eruption. Meteorol Appl 14:27–38Yu T, Rose WI, Prata AJ (2002) Atmospheric correction for satellite-based <strong>volcanic</strong> ash mapping <strong>and</strong>retrievals using split window IR data from GOES <strong>and</strong> AVHRR. J Geophys Res 107(D16):4311. doi:10.1029/2001JD000706123