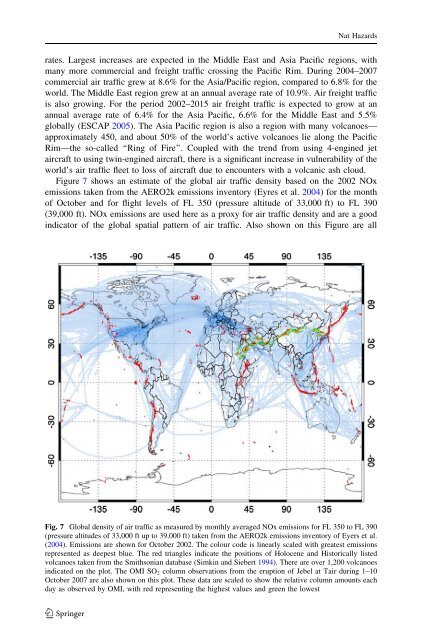
Nat Hazardsrates. Largest increases are expected in the Middle East <strong>and</strong> Asia Pacific regions, withmany more commercial <strong>and</strong> freight traffic crossing the Pacific Rim. During 2004–2007commercial air traffic grew at 8.6% for the Asia/Pacific region, compared to 6.8% for theworld. The Middle East region grew at an annual average rate <strong>of</strong> 10.9%. Air freight trafficis also growing. For the period 2002–2015 air freight traffic is expected to grow at anannual average rate <strong>of</strong> 6.4% for the Asia Pacific, 6.6% for the Middle East <strong>and</strong> 5.5%globally (ESCAP 2005). The Asia Pacific region is also a region with many volcanoes—approximately 450, <strong>and</strong> about 50% <strong>of</strong> the world’s active volcanoes lie along the PacificRim—the so-called ‘‘Ring <strong>of</strong> Fire’’. Coupled with the trend from using 4-engined jetaircraft to using twin-engined aircraft, there is a significant increase in vulnerability <strong>of</strong> theworld’s air traffic fleet to loss <strong>of</strong> aircraft due to encounters with a <strong>volcanic</strong> ash cloud.Figure 7 shows an estimate <strong>of</strong> the global air traffic density based on the 2002 NOxemissions taken from the AERO2k emissions inventory (Eyres et al. 2004) for the month<strong>of</strong> October <strong>and</strong> for flight levels <strong>of</strong> FL 350 (pressure altitude <strong>of</strong> 33,000 ft) to FL 390(39,000 ft). NOx emissions are used here as a proxy for air traffic density <strong>and</strong> are a goodindicator <strong>of</strong> the global spatial pattern <strong>of</strong> air traffic. Also shown on this Figure are allFig. 7 Global density <strong>of</strong> air traffic as measured by monthly averaged NOx emissions for FL 350 to FL 390(pressure altitudes <strong>of</strong> 33,000 ft up to 39,000 ft) taken from the AERO2k emissions inventory <strong>of</strong> Eyers et al.(2004). Emissions are shown for October 2002. The colour code is linearly scaled with greatest emissionsrepresented as deepest blue. The red triangles indicate the positions <strong>of</strong> Holocene <strong>and</strong> Historically listedvolcanoes taken from the Smithsonian database (Simkin <strong>and</strong> Siebert 1994). There are over 1,200 volcanoesindicated on the plot. The OMI SO 2 column observations from the eruption <strong>of</strong> Jebel at Tair during 1–10October 2007 are also shown on this plot. These data are scaled to show the relative column amounts eachday as observed by OMI, with red representing the highest values <strong>and</strong> green the lowest123
Nat HazardsHolocene <strong>and</strong> historically known volcanoes (Simkin <strong>and</strong> Seibert 1994). The greatest trafficdensities are seen over Europe <strong>and</strong> North America, with noticeable air traffic trajectoriesacross the north Atlantic (the NATs) <strong>and</strong> from Japan to south-east Asian populationcentres. To illustrate the vulnerability <strong>of</strong> air traffic to encounters with <strong>volcanic</strong> <strong>clouds</strong>, theOMI SO 2 cloud observations from the eruption <strong>of</strong> Jebel at Tair during 1–10 October, 2007are overlaid onto the Figure. Eckhardt et al. (2008) estimate that the cloud travelled mostlyjust above the tropopause at altitudes between 14 <strong>and</strong> 16 km. As most commercial aircraftcruise at around 13 km (39,000 ft) this may not have been a problem for currently operatingair traffic, however should fleets <strong>of</strong> HSCT aircraft operate in the future, dispersed<strong>volcanic</strong> debris, far from its source will become an increasing risk to these aircraft. Latermodelled trajectories suggest that the cloud may have re-entered the troposphere <strong>and</strong>re-curved south <strong>and</strong> westwards towards India, where OMI also observed the cloud, albeit atmuch lower concentrations.With increased air traffic over the Asia/Pacific region <strong>and</strong> with many active volcanoeslocated there, it is concluded that this region will become increasingly vulnerable toaviation/<strong>volcanic</strong> cloud encounters. The potential for an encounter is illustrated using theair traffic density forecast for 2025 <strong>and</strong> an eruption from a remote volcano located in theNorthern Mariana Isl<strong>and</strong>s. During 2003 until the present, Anatahan volcano in the NorthernMariana Isl<strong>and</strong>s (16.35° N, 145.67° E) has been emitting ash <strong>clouds</strong> into the atmosphere atregular intervals. This volcano lies under an air route from Guam <strong>and</strong> Saipan to Japan <strong>and</strong>ash <strong>clouds</strong> from the volcano frequently intercept the major air routes from south-eastAustralia, <strong>and</strong> the Philippines to Japan <strong>and</strong> Korea. Figure 8 shows the coincidence <strong>of</strong>forecast April 2025 air traffic density (FL 350 to FL 390) with volcanoes <strong>and</strong> an AIRS SO 2cloud from Anatahan for April 2005. This cloud covered an area <strong>of</strong> more than 1.3 millionkm 2 over 3 days in April, reached an altitude <strong>of</strong> at least 15 km (*48,000 ft) <strong>and</strong> airtraffic was diverted on several occasions. The ash <strong>and</strong> gas cloud continued to spreadwestwards, eventually intercepting Philippine air space <strong>and</strong> continued on towards theSouth China Sea. At most times <strong>of</strong> the year, eruptions in this region are likely to send ashwestwards <strong>and</strong> into busy air corridors involving south-east Asia, Japan, Korea <strong>and</strong>Australia.6 Conclusions<strong>Satellite</strong> instruments are able to identify <strong>and</strong> track <strong>hazardous</strong> ash <strong>and</strong> SO 2 <strong>clouds</strong> in theatmosphere for hours to several weeks. Ash has a considerably shorter lifetime (*hours) inthe atmosphere than SO 2 (*days to weeks) <strong>and</strong> is more difficult to identify <strong>and</strong> quantify.Ash is much more <strong>hazardous</strong> to jet aircraft than SO 2 <strong>and</strong> has been responsible for severalcomplete engine shut-downs <strong>and</strong> significant air-frame damage. Under favourable circumstancesit appears that by tracking SO 2 <strong>clouds</strong> from satellite, the movement <strong>of</strong> the more<strong>hazardous</strong> ash <strong>clouds</strong> may be inferred, but care must be taken as there are documentedcases (Schneider et al. 1999; Prata <strong>and</strong> Kerkmann 2007) where ash <strong>and</strong> SO 2 separate <strong>and</strong>travel in different directions <strong>and</strong> at different heights in the atmosphere. Operationally thereare no reliable ash cloud height estimates available from satellites. The CALIPSO lidar canprovide excellent height estimates for aerosols (H 2 SO 4 aerosol in the case <strong>of</strong> <strong>volcanic</strong><strong>clouds</strong>), but the poor horizontal spatial coverage <strong>and</strong> poor temporal coverage make theinstrument inadequate for operational use. The recent study by Eckhardt et al. (2008) hasshown that by using satellite estimates <strong>of</strong> <strong>volcanic</strong> cloud trajectories with Lagrangi<strong>and</strong>ispersion models, the injection height pr<strong>of</strong>ile <strong>of</strong> the <strong>volcanic</strong> eruption may be estimated.123