Caché Monitoring Guide - InterSystems Documentation
Caché Monitoring Guide - InterSystems Documentation
Caché Monitoring Guide - InterSystems Documentation
You also want an ePaper? Increase the reach of your titles
YUMPU automatically turns print PDFs into web optimized ePapers that Google loves.
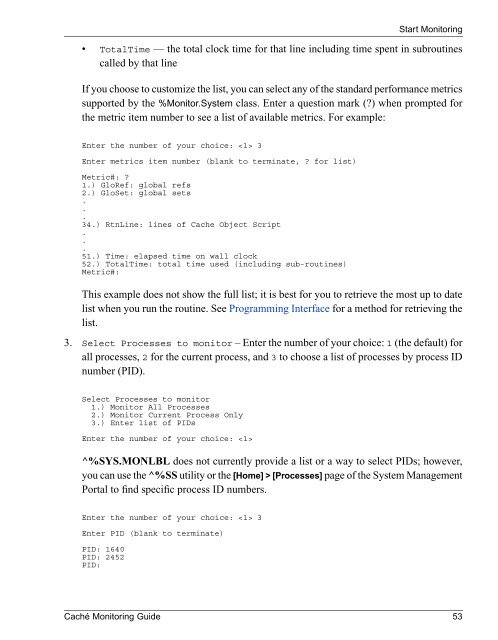
Start <strong>Monitoring</strong>• TotalTime — the total clock time for that line including time spent in subroutinescalled by that lineIf you choose to customize the list, you can select any of the standard performance metricssupported by the %Monitor.System class. Enter a question mark (?) when prompted forthe metric item number to see a list of available metrics. For example:Enter the number of your choice: 3Enter metrics item number (blank to terminate, ? for list)Metric#: ?1.) GloRef: global refs2.) GloSet: global sets...34.) RtnLine: lines of Cache Object Script...51.) Time: elapsed time on wall clock52.) TotalTime: total time used (including sub-routines)Metric#:This example does not show the full list; it is best for you to retrieve the most up to datelist when you run the routine. See Programming Interface for a method for retrieving thelist.3. Select Processes to monitor – Enter the number of your choice: 1 (the default) forall processes, 2 for the current process, and 3 to choose a list of processes by process IDnumber (PID).Select Processes to monitor1.) Monitor All Processes2.) Monitor Current Process Only3.) Enter list of PIDsEnter the number of your choice: ^%SYS.MONLBL does not currently provide a list or a way to select PIDs; however,you can use the ^%SS utility or the [Home] > [Processes] page of the System ManagementPortal to find specific process ID numbers.Enter the number of your choice: 3Enter PID (blank to terminate)PID: 1640PID: 2452PID:<strong>Caché</strong> <strong>Monitoring</strong> <strong>Guide</strong> 53


