Caché Monitoring Guide - InterSystems Documentation
Caché Monitoring Guide - InterSystems Documentation
Caché Monitoring Guide - InterSystems Documentation
Create successful ePaper yourself
Turn your PDF publications into a flip-book with our unique Google optimized e-Paper software.
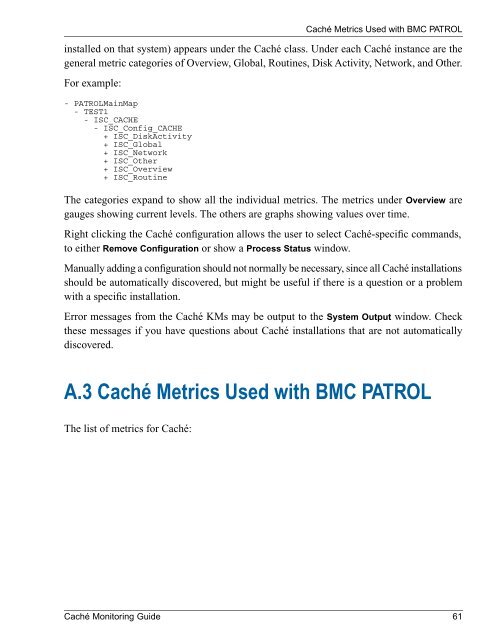
installed on that system) appears under the <strong>Caché</strong> class. Under each <strong>Caché</strong> instance are thegeneral metric categories of Overview, Global, Routines, Disk Activity, Network, and Other.For example:- PATROLMainMap- TEST1- ISC_CACHE- ISC_Config_CACHE+ ISC_DiskActivity+ ISC_Global+ ISC_Network+ ISC_Other+ ISC_Overview+ ISC_Routine<strong>Caché</strong> Metrics Used with BMC PATROLThe categories expand to show all the individual metrics. The metrics under Overview aregauges showing current levels. The others are graphs showing values over time.Right clicking the <strong>Caché</strong> configuration allows the user to select <strong>Caché</strong>-specific commands,to either Remove Configuration or show a Process Status window.Manually adding a configuration should not normally be necessary, since all <strong>Caché</strong> installationsshould be automatically discovered, but might be useful if there is a question or a problemwith a specific installation.Error messages from the <strong>Caché</strong> KMs may be output to the System Output window. Checkthese messages if you have questions about <strong>Caché</strong> installations that are not automaticallydiscovered.A.3 <strong>Caché</strong> Metrics Used with BMC PATROLThe list of metrics for <strong>Caché</strong>:<strong>Caché</strong> <strong>Monitoring</strong> <strong>Guide</strong> 61


