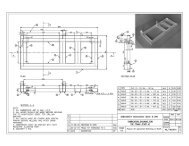
SubSurface Dams - Sustainable Sanitation and Water Management ...
SubSurface Dams - Sustainable Sanitation and Water Management ...
SubSurface Dams - Sustainable Sanitation and Water Management ...

You also want an ePaper? Increase the reach of your titles
YUMPU automatically turns print PDFs into web optimized ePapers that Google loves.
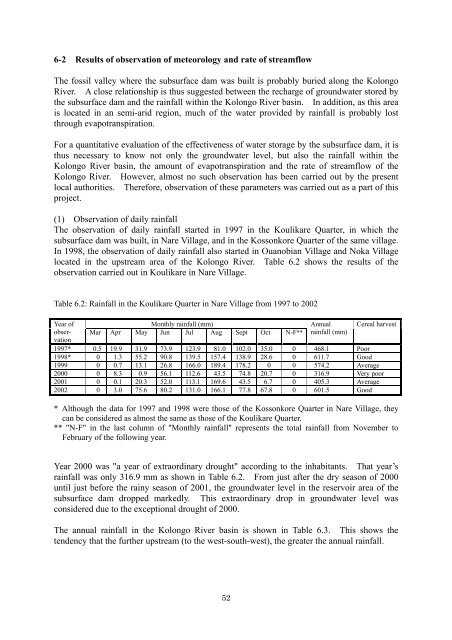
6-2 Results of observation of meteorology <strong>and</strong> rate of streamflowThe fossil valley where the subsurface dam was built is probably buried along the KolongoRiver. A close relationship is thus suggested between the recharge of groundwater stored bythe subsurface dam <strong>and</strong> the rainfall within the Kolongo River basin. In addition, as this areais located in an semi-arid region, much of the water provided by rainfall is probably lostthrough evapotranspiration.For a quantitative evaluation of the effectiveness of water storage by the subsurface dam, it isthus necessary to know not only the groundwater level, but also the rainfall within theKolongo River basin, the amount of evapotranspiration <strong>and</strong> the rate of streamflow of theKolongo River. However, almost no such observation has been carried out by the presentlocal authorities. Therefore, observation of these parameters was carried out as a part of thisproject.(1) Observation of daily rainfallThe observation of daily rainfall started in 1997 in the Koulikare Quarter, in which thesubsurface dam was built, in Nare Village, <strong>and</strong> in the Kossonkore Quarter of the same village.In 1998, the observation of daily rainfall also started in Ouanobian Village <strong>and</strong> Noka Villagelocated in the upstream area of the Kolongo River. Table 6.2 shows the results of theobservation carried out in Koulikare in Nare Village.Table 6.2: Rainfall in the Koulikare Quarter in Nare Village from 1997 to 2002Year ofobservationMonthly rainfall (mm)Mar Apr May Jun Jul Aug Sept Oct N-F**Annualrainfall (mm)Cereal harvest1997* 0.5 19.9 31.9 73.9 123.9 81.0 102.0 35.0 0 468.1 Poor1998* 0 1.3 55.2 90.8 139.5 157.4 138.9 28.6 0 611.7 Good1999 0 0.7 13.1 26.8 166.0 189.4 178.2 0 0 574.2 Average2000 0 8.3 0.9 56.1 112.6 43.5 74.8 20.7 0 316.9 Very poor2001 0 0.1 20.3 52.0 113.1 169.6 43.5 6.7 0 405.3 Average2002 0 3.0 75.6 80.2 131.0 166.1 77.8 67.8 0 601.5 Good* Although the data for 1997 <strong>and</strong> 1998 were those of the Kossonkore Quarter in Nare Village, theycan be considered as almost the same as those of the Koulikare Quarter.** "N-F" in the last column of "Monthly rainfall" represents the total rainfall from November toFebruary of the following year.Year 2000 was "a year of extraordinary drought" according to the inhabitants. That year’srainfall was only 316.9 mm as shown in Table 6.2. From just after the dry season of 2000until just before the rainy season of 2001, the groundwater level in the reservoir area of thesubsurface dam dropped markedly. This extraordinary drop in groundwater level wasconsidered due to the exceptional drought of 2000.The annual rainfall in the Kolongo River basin is shown in Table 6.3. This shows thetendency that the further upstream (to the west-south-west), the greater the annual rainfall.52