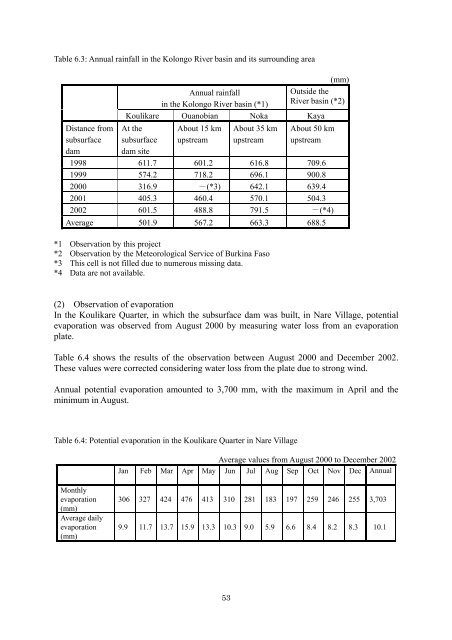
Table 6.3: Annual rainfall in the Kolongo River basin <strong>and</strong> its surrounding areaDistance fromsubsurfacedam(mm)Annual rainfallin the Kolongo River basin (*1)Outside theRiver basin (*2)Koulikare Ouanobian Noka KayaAt thesubsurfacedam siteAbout 15 kmupstreamAbout 35 kmupstreamAbout 50 kmupstream1998 611.7 601.2 616.8 709.61999 574.2 718.2 696.1 900.82000 316.9 -(*3) 642.1 639.42001 405.3 460.4 570.1 504.32002 601.5 488.8 791.5 -(*4)Average 501.9 567.2 663.3 688.5*1 Observation by this project*2 Observation by the Meteorological Service of Burkina Faso*3 This cell is not filled due to numerous missing data.*4 Data are not available.(2) Observation of evaporationIn the Koulikare Quarter, in which the subsurface dam was built, in Nare Village, potentialevaporation was observed from August 2000 by measuring water loss from an evaporationplate.Table 6.4 shows the results of the observation between August 2000 <strong>and</strong> December 2002.These values were corrected considering water loss from the plate due to strong wind.Annual potential evaporation amounted to 3,700 mm, with the maximum in April <strong>and</strong> theminimum in August.Table 6.4: Potential evaporation in the Koulikare Quarter in Nare VillageAverage values from August 2000 to December 2002Jan Feb Mar Apr May Jun Jul Aug Sep Oct Nov Dec AnnualMonthlyevaporation(mm)Average dailyevaporation(mm)306 327 424 476 413 310 281 183 197 259 246 255 3,7039.9 11.7 13.7 15.9 13.3 10.3 9.0 5.9 6.6 8.4 8.2 8.3 10.153
(3) Observation of rate of streamflowTo estimate the rate of streamflow of the Kolongo River that probably recharges thegroundwater stored by the subsurface dam, the rate of streamflow <strong>and</strong> the level of the riverwater were observed at the points where the geometry of the cross-section of the river couldbe measured easily. The observations were conducted at two points: where the old mainroad crosses the Kolongo River, <strong>and</strong> where the current main road crosses the river.The observation was carried out for 5 years from 1998 to 2002, but reliable results wereobtained only in 2000 <strong>and</strong> 2001. The rate of streamflow where the old main road crosses theriver, calculated from the results of the observation, was as follows:in 2000 (exceptional drought year): about 6,000,000 m 3 /yearin 2001: about 11,000,000 m 3 /year6-3 Fluctuation in the groundwater level in the reservoir area(1) Assessment of the effectiveness of the subsurface dam for water storageFigure 6.3 shows the water storage state by the subsurface dam at two periods after theconstruction of the dam, i.e., on 2 October 1998 (at the beginning of the dry season) <strong>and</strong> from19 to 24 February 1999 (in the middle of the dry season).In these two periods, the reserved water level was higher by 4.5 to 6.5 m compared with thegroundwater level downstream of the dam. It was also higher by 2.5 to 5 m compared withthe groundwater level in the corresponding seasons before the construction of the dam. Allthese results proved the effectiveness of the subsurface dam for water storage.(2) Seasonal fluctuation in the reserved water levelHowever, the reserved water level fell in the dry season, as the comparison of the results ofthe observation in the two periods in Fig. 6.3 shows. Indeed, some of the reserved water waspumped out, but the amount of such water was tiny compared with the whole reserved water(the amount of pumped out water was 3,000 m 3 /year (see Section 7.(1)), whereas theestimated reserved water volume was about 400,000 m 3 at the end of the dry season of 2002(see Section 6-5)), <strong>and</strong> could not have caused the fall in the reserved water level.Such "seasonal fluctuation" in the reserved water level occurred every year. As a proof ofthis, Fig. 6.4 shows the results of the continuous observation of the groundwater level fromJune 1998 to February 2003 at the well P-4 (a “well of the all-strainer type”) located about200 m upstream of the subsurface dam. This figure also shows the groundwater levelobserved from November 1996 to November 1997 in the well B-2-4 located at the dam site,for comparison with the groundwater level before the construction of the dam.(3) Interannual fluctuation in the reserved water levelThe results of the observation of the reserved water level shown in Fig. 6.4 show thefollowing characteristics of interannual fluctuation in the reserved water level.1) Every year, the reserved water level rose in the rainy season <strong>and</strong> fell by 2.5 to 4.5mby May <strong>and</strong> June, i.e., between the end of the dry season <strong>and</strong> the beginning of the rainyseason.2) The lowest level in a year, which was recorded between the end of the dry season<strong>and</strong> the beginning of the rainy season, rose year by year except in 2001.54