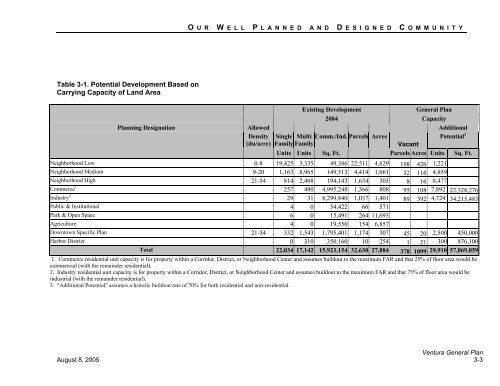
C H A P T E R 3Our “Infill First” strategy for <strong>Ventura</strong> meansavoiding suburban sprawl by directing newdevelopment to vacant land in the <strong>City</strong> andSphere of Influence (with the exception ofSOAR land), and by focusing new public andprivate investment in carefully selected districts,corridors, and neighborhood centers whereconcentrated development and adaptive reusewill improve the standard of living and quality oflife for the entire community.Recognizing that the rate of future populationgrowth is not subject to <strong>City</strong> control, this planhas been analyzed (in the accompanyingEnvironmental Impact Report) on the basis ofestimates of what new homes and otherdevelopment might be expected to take placeover the next twenty years (see Table 3-2).Looking at the rate of growth over the pastdecade and recognizing the challenges to "infill"development compared to "greenfield"expansion, a projection of roughly 8,300additional housing units and approximately 5million square feet of non-residentialdevelopment has been used for the plan's 20year planning horizon. Table 3-2 providesestimates of the amount of development thatcould reasonably be expected to occur in the<strong>City</strong> and Sphere of Influence.development than shown in Table 3-2. Todemonstrate this, Table 3-1 shows the potentialdevelopment based on the overall carryingcapacity of the land.Distribution of growth in the districts andcorridors is based on the following generalassumptions:• Development in the Downtown and HarborDistricts will conform to the plans for thoseareas,• The Downtown area and, to a lesser extent,the <strong>Ventura</strong> Avenue corridor will be thefocus of future residential and commercialgrowth, and• The Arundell, North Avenue, and UpperNorth Avenue areas will be the focus offuture economic growth, potential expansionof the Brooks Institute, with some residentialuses.The actual distribution of future growth in the<strong>City</strong> may vary based on market forces andother factors. The districts, corridors, andneighborhood center areas, shown on Figure 3-1 Infill Areas, could accommodate moredevelopment and/or a different mix of<strong>2005</strong> <strong>Ventura</strong> <strong>General</strong> <strong>Plan</strong>3-2August 8, <strong>2005</strong>
O U R W E L L P L A N N E D A N D D E S I G N E D C O M M U N I T YTable 3-1. Potential Development Based onCarrying Capacity of Land AreaExisting Development<strong>General</strong> <strong>Plan</strong>2004 Capacity<strong>Plan</strong>ning Designation Allowed AdditionalDensity Single Multi Comm./Ind. Parcels AcresPotential 3(du/acre) Family FamilyVacantUnits Units Sq. Ft. Parcels Acres Units Sq. Ft.Neighborhood Low 0-8 19,425 3,335 49,386 22,511 4,629 108 426 1,221Neighborhood Medium 9-20 1,163 8,965 149,513 4,414 1,061 32 116 4,859Neighborhood High 21-54 814 2,468 194,143 1,634 303 8 16 8,477Commerce 1 257 490 4,995,248 1,366 808 95 108 7,892 22,328,276Industry 2 29 31 8,299,840 1,037 1,401 89 392 4,724 34,215,483Public & Institutional 4 0 54,422 66 571Park & Open Space 6 0 15,491 264 11,693Agriculture 4 0 19,550 154 6,857Downtown Specific <strong>Plan</strong> 21-54 332 1,543 1,795,401 1,174 307 45 20 2,500 450,000Harbor District 0 310 350,160 10 254 1 21 300 876,100Total 22,034 17,142 15,923,154 32,630 27,884 378 1099 29,910 57,869,8591. Commerce residential unit capacity is for property within a Corridor, District, or Neighborhood Center and assumes buildout to the maximum FAR and that 25% of floor area would becommercial (with the remainder residential).2. Industry residential unit capacity is for property within a Corridor, District, or Neighborhood Center and assumes buildout to the maximum FAR and that 75% of floor area would beindustrial (with the remainder residential).3. "Additional Potential" assumes a historic buildout rate of 70% for both residential and non-residential.<strong>Ventura</strong> <strong>General</strong> <strong>Plan</strong>August 8, <strong>2005</strong> 3-3