Official Proceedings - AIUM
Official Proceedings - AIUM
Official Proceedings - AIUM
Create successful ePaper yourself
Turn your PDF publications into a flip-book with our unique Google optimized e-Paper software.
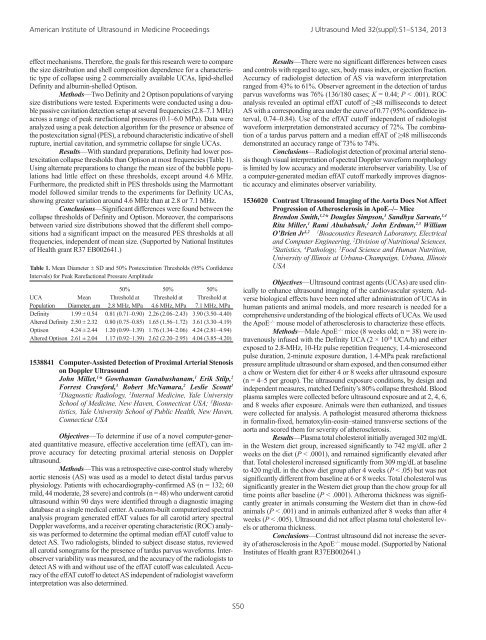
American Institute of Ultrasound in Medicine <strong>Proceedings</strong> J Ultrasound Med 32(suppl):S1–S134, 2013effect mechanisms. Therefore, the goals for this research were to comparethe size distribution and shell composition dependence for a characteristictype of collapse using 2 commercially available UCAs, lipid-shelledDefinity and albumin-shelled Optison.Methods—Two Definity and 2 Optison populations of varyingsize distributions were tested. Experiments were conducted using a doublepassive cavitation detection setup at several frequencies (2.8–7.1 MHz)across a range of peak rarefactional pressures (0.1–6.0 MPa). Data wereanalyzed using a peak detection algorithm for the presence or absence ofthe postexcitation signal (PES), a rebound characteristic indicative of shellrupture, inertial cavitation, and symmetric collapse for single UCAs.Results—With standard preparations, Definity had lower postexcitationcollapse thresholds than Optison at most frequencies (Table 1).Using alternate preparations to change the mean size of the bubble populationshad little effect on these thresholds, except around 4.6 MHz.Furthermore, the predicted shift in PES thresholds using the Marmottantmodel followed similar trends to the experiments for Definity UCAs,showing greater variation around 4.6 MHz than at 2.8 or 7.1 MHz.Conclusions—Significant differences were found between thecollapse thresholds of Definity and Optison. Moreover, the comparisonsbetween varied size distributions showed that the different shell compositionshad a significant impact on the measured PES thresholds at allfrequencies, independent of mean size. (Supported by National Institutesof Health grant R37 EB002641.)Table 1. Mean Diameter ± SD and 50% Postexcitation Thresholds (95% ConfidenceIntervals) for Peak Rarefactional Pressure Amplitude50% 50% 50%UCA Mean Threshold at Threshold at Threshold atPopulation Diameter, µm 2.8 MHz, MPa 4.6 MHz, MPa 7.1 MHz, MPaDefinity 1.99 ± 0.54 0.81 (0.71–0.90) 2.26 (2.06–2.43) 3.90 (3.50–4.40)Altered Definity 2.50 ± 2.32 0.80 (0.75–0.85) 1.65 (1.56–1.72) 3.61 (3.30–4.19)Optison 4.24 ± 2.44 1.20 (0.99–1.39) 1.76 (1.34–2.06) 4.24 (2.81–4.94)Altered Optison 2.61 ± 2.04 1.17 (0.92–1.39) 2.62 (2.20–2.95) 4.04 (3.85–4.20)1538841 Computer-Assisted Detection of Proximal Arterial Stenosison Doppler UltrasoundJohn Millet, 1 * Gowthaman Gunabushanam, 1 Erik Stilp, 2Forrest Crawford, 3 Robert McNamara, 2 Leslie Scoutt 11Diagnostic Radiology, 2 Internal Medicine, Yale UniversitySchool of Medicine, New Haven, Connecticut USA; 3 Biostatistics,Yale University School of Public Health, New Haven,Connecticut USAObjectives—To determine if use of a novel computer-generatedquantitative measure, effective acceleration time (effAT), can improveaccuracy for detecting proximal arterial stenosis on Dopplerultrasound.Methods—This was a retrospective case-control study wherebyaortic stenosis (AS) was used as a model to detect distal tardus parvusphysiology. Patients with echocardiography-confirmed AS (n = 132; 60mild, 44 moderate, 28 severe) and controls (n = 48) who underwent carotidultrasound within 90 days were identified through a diagnostic imagingdatabase at a single medical center. A custom-built computerized spectralanalysis program generated effAT values for all carotid artery spectralDoppler waveforms, and a receiver operating characteristic (ROC) analysiswas performed to determine the optimal median effAT cutoff value todetect AS. Two radiologists, blinded to subject disease status, reviewedall carotid sonograms for the presence of tardus parvus waveforms. Interobservervariability was measured, and the accuracy of the radiologists todetect AS with and without use of the effAT cutoff was calculated. Accuracyof the effAT cutoff to detect AS independent of radiologist waveforminterpretation was also determined.Results—There were no significant differences between casesand controls with regard to age, sex, body mass index, or ejection fraction.Accuracy of radiologist detection of AS via waveform interpretationranged from 43% to 61%. Observer agreement in the detection of tardusparvus waveforms was 76% (136/180 cases; Κ = 0.44; P < .001). ROCanalysis revealed an optimal effAT cutoff of ≥48 milliseconds to detectAS with a corresponding area under the curve of 0.77 (95% confidence interval,0.74–0.84). Use of the effAT cutoff independent of radiologistwaveform interpretation demonstrated accuracy of 72%. The combinationof a tardus parvus pattern and a median effAT of ≥48 millisecondsdemonstrated an accuracy range of 73% to 74%.Conclusions—Radiologist detection of proximal arterial stenosisthough visual interpretation of spectral Doppler waveform morphologyis limited by low accuracy and moderate interobserver variability. Use ofa computer-generated median effAT cutoff markedly improves diagnosticaccuracy and eliminates observer variability.1536020 Contrast Ultrasound Imaging of the Aorta Does Not AffectProgression of Atherosclerosis in ApoE–/– MiceBrendon Smith, 1,2 * Douglas Simpson, 3 Sandhya Sarwate, 1,4Rita Miller, 1 Rami Abuhabsah, 1 John Erdman, 2,5 WilliamO’Brien Jr 1,2 1 Bioacoustics Research Laboratory, Electricaland Computer Engineering, 2 Division of Nutritional Sciences,3Statistics, 4 Pathology, 5 Food Science and Human Nutrition,University of Illinois at Urbana-Champaign, Urbana, IllinoisUSAObjectives—Ultrasound contrast agents (UCAs) are used clinicallyto enhance ultrasound imaging of the cardiovascular system. Adversebiological effects have been noted after administration of UCAs inhuman patients and animal models, and more research is needed for acomprehensive understanding of the biological effects of UCAs. We usedthe ApoE –/– mouse model of atherosclerosis to characterize these effects.Methods—Male ApoE –/– mice (8 weeks old; n = 38) were intravenouslyinfused with the Definity UCA (2 × 10 10 UCA/h) and eitherexposed to 2.8-MHz, 10-Hz pulse repetition frequency, 1.4-microsecondpulse duration, 2-minute exposure duration, 1.4-MPa peak rarefactionalpressure amplitude ultrasound or sham exposed, and then consumed eithera chow or Western diet for either 4 or 8 weeks after ultrasound exposure(n = 4–5 per group). The ultrasound exposure conditions, by design andindependent measures, matched Definity’s 80% collapse threshold. Bloodplasma samples were collected before ultrasound exposure and at 2, 4, 6,and 8 weeks after exposure. Animals were then euthanized, and tissueswere collected for analysis. A pathologist measured atheroma thicknessin formalin-fixed, hematoxylin-eosin–stained transverse sections of theaorta and scored them for severity of atherosclerosis.Results—Plasma total cholesterol initially averaged 302 mg/dLin the Western diet group, increased significantly to 742 mg/dL after 2weeks on the diet (P < .0001), and remained significantly elevated afterthat. Total cholesterol increased significantly from 309 mg/dL at baselineto 420 mg/dL in the chow diet group after 4 weeks (P < .05) but was notsignificantly different from baseline at 6 or 8 weeks. Total cholesterol wassignificantly greater in the Western diet group than the chow group for alltime points after baseline (P < .0001). Atheroma thickness was significantlygreater in animals consuming the Western diet than in chow-fedanimals (P < .001) and in animals euthanized after 8 weeks than after 4weeks (P < .005). Ultrasound did not affect plasma total cholesterol levelsor atheroma thickness.Conclusions—Contrast ultrasound did not increase the severityof atherosclerosis in the ApoE –/– mouse model. (Supported by NationalInstitutes of Health grant R37EB002641.)S50


